Wir bringen Klarheit in die KI im Finanzbereich: Wir stellen vor: GSmart


KI verändert die Spielregeln im Finanzwesen, aber die meisten Lösungen sind nicht für die besonderen Anforderungen des Finanzministeriums konzipiert. Black-Box-Modelle, generische Plattformen und unverbundene Tools werfen mehr Fragen als Antworten auf.
Deshalb hat Ripple Treasury gebaut GSmart, die einzige Treasury-spezifische KI-Lösung.
Sehen Sie sich eine Aufzeichnung unseres letzten Webinars an,“Wir bringen Klarheit in die KI im Finanzbereich: Wir stellen vor: GSmart„, um zu sehen, wie speziell entwickelte KI Einblicke in Echtzeit, intelligente Automatisierung und erklärbare Ergebnisse liefern kann.
Transkript
00:00:14.130 --> 00:00:24.260
GTreasury Marketing: Hallo zusammen, und danke, dass Sie heute zu uns gekommen sind. Wir werden in ein paar Minuten beginnen, um allen unseren Teilnehmern Zeit zu geben, am Webinar teilzunehmen. Also bleiben Sie ruhig und wir werden in Kürze beginnen.
00:01:27.300 --> 00:01:37.979
Treasury Marketing: Okay, hallo, alle zusammen. Vielen Dank, dass Sie heute an unserem Webinar teilgenommen haben, das Klarheit in Sachen KI bringt und G. Smart vorstellt. Lassen Sie uns ein paar Dinge rund um die Haushaltsführung besprechen, bevor wir beginnen.
00:01:39.800 --> 00:01:59.430
GTreasury Marketing: Die heutige Veranstaltung wird voraussichtlich eine Stunde dauern, einschließlich Zeit für Fragen. Am Ende sind alle Teilnehmer stummgeschaltet. Wenn Sie während der Präsentation zu irgendeinem Zeitpunkt Fragen haben, geben Sie diese bitte in den Q&A-Bereich auf Ihrer Zoom-Steuerleiste ein. Dieses Webinar wird aufgezeichnet und ein Link zur Aufzeichnung wird per E-Mail an alle Teilnehmer gesendet.
00:02:01.710 --> 00:02:08.490
Treasury Marketing: Unsere heutigen Redner sind Evan Ryan und Mark Johnson. Deshalb werde ich es ihnen für eine kurze Einführung übergeben.
00:02:09.710 --> 00:02:31.199
Evan Ryan: Vielen Dank. Schön, heute hier bei euch zu sein. Mein Name ist Evan Ryan. Ich bin Produktmanager hier im Finanzministerium und spezifiziere mich auf Liquiditätsprognosen. Ich werde heute am Ende der Präsentation mit der Demo beginnen und freue mich sehr, Ihnen zeigen zu können, woran wir in den letzten Wochen gearbeitet haben
00:02:31.320 --> 00:02:32.459
Evan Ryan: Zu dir, Mark.
00:02:33.210 --> 00:02:55.960
Mark Johnson: Fantastisch. Danke, Evan. Also nochmal, heiße alle willkommen. Ich bin Mark Johnson, Chief Product Officer bei G. Treasury. Ich leite unsere globalen Produktmanagement-Design- und Quantteams. Ich habe den größten Teil meiner Karriere an dieser Schnittstelle von Finanzen und Technologie verbracht, von Zahlungen und Ressourcenmanagement bis hin zu Finanzautomatisierung und Gehaltsabrechnung
00:02:56.090 --> 00:03:06.140
Mark Johnson: Ich freue mich sehr, heute mit Ihnen zusammen zu sein und darüber zu sprechen, wie wir Treasury-Teams wie Ihnen helfen können, einem Teil der manuellen Arbeit zu entkommen, von der wir wissen, dass wir alle damit umgehen müssen.
00:03:06.820 --> 00:03:11.649
Mark Johnson: Damit werden wir uns auf einen kleinen Teil unserer Reise einlassen.
00:03:12.020 --> 00:03:22.200
Mark Johnson: Wenn wir über die Zeit nachdenken, die wir heute haben, werden wir uns stark auf Bildung konzentrieren, aber auch diese Bildung nutzen und in die Tat umsetzen.
00:03:22.410 --> 00:03:36.660
Mark Johnson: Sie werden sehen, was auf dem Markt passiert, wenn es um KI im Finanzwesen geht. Wir werden einige Statistiken veröffentlichen und darüber sprechen, wohin sich Unternehmen bewegen und warum diese Transformation nicht warten kann.
00:03:37.170 --> 00:03:57.870
Mark Johnson: Wir werden über G. Smart sprechen. G. Smart ist unsere KI-Philosophie, nach der wir wirklich darüber nachdenken, Sie und Ihre Teams zu verstärken, anstatt etwas sehr Taktisches zu erweitern oder wegzunehmen. Es geht um viel mehr als das, wenn es um die Strategie geht, die wir hoffentlich Ihren Teams zur Verfügung stellen können.
00:03:58.350 --> 00:04:14.209
Mark Johnson: Wir werden gleich darauf eingehen, wohin wir aus Sicht der Produktinnovation gehen, während wir darüber nachdenken, die Treasury-Workflows so zu gestalten, wie es Evan gesagt hat. Wir werden das Ganze in Form einer echten Live-Produktionsdemo präsentieren
00:04:14.340 --> 00:04:20.519
Mark Johnson: Und dann gebe ich dir sozusagen einen Blick hinter die Kulissen. Schauen Sie sich an, worauf wir uns in letzter Zeit konzentriert haben.
00:04:21.130 --> 00:04:22.230
Mark Johnson: Q. Und ein.
00:04:22.400 --> 00:04:35.679
Mark Johnson: Wie wir oben erwähnt haben, sehr wichtig für uns. Also springen Sie bitte ein und nutzen Sie die Q & A-Funktion an jeder Stelle, wenn Fragen auftauchen. Wenn wir heute nicht alle Fragen beantworten können, werden wir individuell darauf eingehen
00:04:36.508 --> 00:04:53.720
Mark Johnson: Bitte stellen Sie sicher, dass Sie diese Funktion verwenden. Das Letzte, womit ich beginnen werde, ist, dass wir heute mit einem Ziel gestaltet werden wollen: Ihnen zu helfen, Zeit zu gewinnen, um das zu tun, was Sie am besten können, strategisch zu denken, Beziehungen aufzubauen und letztendlich Ihr Unternehmen voranzubringen.
00:04:55.780 --> 00:05:16.360
Mark Johnson: Der richtige Zeitpunkt für das Finanzwesen in Bezug auf KI ist jetzt gekommen, da wir über den immensen Wandel nachdenken, der gerade stattfindet. Es handelt sich nicht um einen allmählichen Wandel, sondern um einen wahrhaft seismischen Wandel und insbesondere die Leistungsfähigkeit generativer KI für viele verschiedene Funktionen.
00:05:16.680 --> 00:05:28.719
Mark Johnson: Dies sind einige Statistiken, die wir verfolgt haben. Diese Statistiken tauchen ständig in neuen Quellen auf. Ich möchte mit ein paar beginnen, denen wir sehr nahe gekommen sind
00:05:29.320 --> 00:05:37.590
Mark Johnson: Die ersten 79% der CFOs planen, die KI-Budgets im Jahr 2025 zu erhöhen.
00:05:38.010 --> 00:05:51.469
Mark Johnson: Der aufschlussreichste und aufschlussreichste Teil dieser Statistik ist die Tatsache, dass dies nicht unbedingt die Early Adopters oder die Tech-Enthusiasten sind. Dies sind pragmatische Führungskräfte im Finanzbereich
00:05:51.840 --> 00:05:53.319
Mark Johnson: Wer hat die Zahlen berechnet
00:05:53.610 --> 00:06:13.949
Mark Johnson: Sie investieren nicht, weil KI im Trend liegt. Sie investieren nicht, weil alle über KI sprechen. Sie investieren, weil sie den wahren Nutzen sehen, und sie führen auch dieses Gespräch mit ihren Kollegen und hören die Gelegenheit, ihren Teams Tag für Tag die Arbeit abzunehmen.
00:06:14.050 --> 00:06:25.829
Mark Johnson: Wenn Sie sehen, dass sich 7, 8 von 10 CFOs in dieselbe Richtung bewegen, können Sie nicht mehr davon ausgehen, dass es sich um einen Trend handelt. Das ist quasi die neue Art zu sein, die neue Art zu arbeiten
00:06:26.580 --> 00:06:28.240
Mark Johnson: Der nächste große Schritt.
00:06:28.660 --> 00:06:35.940
Mark Johnson: 94% der CFOs erwarten, dass generative KI ihre Funktion stark verbessern wird.
00:06:36.340 --> 00:06:42.820
Mark Johnson: In meinen Jahren der Technologiebranche ist es sehr selten, eine so überwältigende Statistik zu sehen.
00:06:43.050 --> 00:06:52.759
Mark Johnson: vor allem eine Vereinbarung über eine strategische Initiative. Wir haben alle an diesen Diskussionen, diesen Sitzungssälen, diesen Vorstandssitzungen teilgenommen. Wenn Sie einen so großen Konsens haben.
00:06:52.890 --> 00:06:55.509
Mark Johnson: Sie wissen, dass die Beweise zu diesem Zeitpunkt unbestreitbar sind.
00:06:56.180 --> 00:07:06.460
Mark Johnson: Wenn wir über die Ergebnisse nachdenken. Nehmen wir einfach Prognosen als einfaches Beispiel, die Möglichkeit, die Genauigkeit um 30% oder mehr zu erhöhen. Das ist ein entscheidender Faktor.
00:07:07.230 --> 00:07:08.849
Mark Johnson: Der 3. große Staat.
00:07:09.340 --> 00:07:23.529
Mark Johnson: 58% der Finanzfunktionen wurden bereits übernommen. KI im Jahr 2024. Nun, das heißt nicht unbedingt, dass das alles generativ ist. KI Traditionelle KI gibt es schon etwas länger, wenn wir an maschinelles Lernen denken.
00:07:23.660 --> 00:07:31.459
Mark Johnson: Aber worüber Sie nachdenken sollten, ist die Tatsache, dass dieser Wert gegenüber den 37% im Vorjahr gestiegen ist.
00:07:31.670 --> 00:07:38.710
Mark Johnson: Das ist ein großer Wandel, und das spricht auch dafür, dass KI und ihre Fähigkeiten immer umfangreicher werden.
00:07:39.480 --> 00:07:43.240
Mark Johnson: Das andere Stück, das andere Schlüsselstück, ist, schauen Sie auf die rechte Seite
00:07:43.590 --> 00:07:46.560
Mark Johnson: wenn wir darüber nachdenken, wo
00:07:46.850 --> 00:07:59.060
Mark Johnson: Es wird wirklich interessant. CFOs wollen KI, auf die sie sich verlassen können. Sie wollen keine Blackboxen. Sie wollen Transparenz. Sie wollen eine Erklärung.
00:07:59.340 --> 00:08:04.539
Mark Johnson: Wir wissen, dass Vertrauen verdient wird. Hier lebt G. Treasury täglich nach diesem Motto.
00:08:05.050 --> 00:08:16.380
Mark Johnson: Dies steht auch im Einklang mit einigen aktuellen Untersuchungen von McKinsey, die ihren eigenen Bericht zum Stand der KI veröffentlicht haben. Und das Faszinierende an diesem Bericht ist die Tatsache
00:08:16.670 --> 00:08:31.339
Mark Johnson: Wir sind jetzt an einem Punkt angelangt, an dem 21% der Unternehmen angaben, generative KI und einen völlig neu konzipierten Arbeitsablauf zu verwenden, eine völlig neu konzipierte Art und Weise, wie Arbeit in einer bestimmten Funktion erledigt wird.
00:08:31.810 --> 00:08:36.569
Mark Johnson: Das andere Stück, das wirklich interessant war, als wir diese Studie durchführten, ist die Tatsache, dass
00:08:37.159 --> 00:08:54.219
Mark Johnson: Wenn Sie an die KI-Transformation denken, handelt es sich im Grunde um eine organisatorische Transformation. Diese Organisation überdenkt die Art und Weise, wie Arbeit erledigt wird, aber auch die Tools, die genutzt werden, um diese Arbeit zu erledigen und die zu erledigende Aufgabe zu erledigen.
00:08:55.110 --> 00:09:06.709
Mark Johnson: Insbesondere der CEO ist derjenige, der häufig an der Überwachung dieser KI-Governance beteiligt ist, eine große Veränderung gegenüber allem, was wir je zuvor in der Technologiewelt gesehen haben.
00:09:10.020 --> 00:09:10.970
Mark Johnson: Also
00:09:11.140 --> 00:09:21.190
Mark Johnson: Worauf wir noch eingehen wollten, bevor wir zu tief gehen, ist eine kurze Umfragefrage darüber, wo ihr euch auf eurer Reise befindet.
00:09:21.560 --> 00:09:24.110
Mark Johnson: Die Frage ist also.
00:09:24.280 --> 00:09:34.230
Mark Johnson: Wann rechnen Sie mit der Implementierung von KI im Finanzbereich? Wir geben allen ein paar Sekunden, um darauf zu antworten, und schauen uns dann die Ergebnisse an.
00:10:24.370 --> 00:10:36.590
Mark Johnson: Okay, es sieht so aus, als ob wir 35% haben, die beabsichtigen, KI im Jahr 2026 zu implementieren, wir haben
00:10:36.770 --> 00:10:49.559
Mark Johnson: Weitere 11%, die heute schon KI verwenden, und dann 16%. Diese planen, KI noch vor Jahresende in ihren Betrieb einzuführen. Also nochmal.
00:10:50.090 --> 00:10:59.850
Mark Johnson: Ziemlich relevant und bezieht sich auf die frühere Folie, die etwa 50 bis 60% bereits eingeführt haben oder planen, dies in naher Zukunft zu tun.
00:11:04.320 --> 00:11:17.789
Mark Johnson: Nun, einige von Ihnen haben vielleicht gesehen, dass unsere Einführung von G. Smart und G. Smart für uns beide ein Meilenstein ist, und es ist ein Ausgangspunkt auf dieser Reise, an der wir jetzt teilnehmen.
00:11:18.030 --> 00:11:28.179
Mark Johnson: Wir haben G. Smart als eine Art Zukunft des KI-gestützten Finanzministeriums vorgestellt. Gleichzeitig ändern wir unser Leitbild als Unternehmen nicht.
00:11:28.300 --> 00:11:35.819
Mark Johnson: Seit Jahren konzentriert sie sich im Finanzministerium auf die Klarheit, um zu handeln und zu versuchen, Werte zu steigern
00:11:36.220 --> 00:11:37.909
Mark Johnson: Für unsere Kunden.
00:11:38.200 --> 00:11:42.229
Mark Johnson: Was sich geändert hat, ist das Ausmaß dessen, was möglich ist.
00:11:42.790 --> 00:11:48.860
Mark Johnson: G. Smart vertritt die Überzeugung, dass das zukünftige Amt des CFO.
00:11:49.050 --> 00:11:53.570
Mark Johnson: Wird nicht nur durch die Aufgaben definiert, die erledigt werden, sondern
00:11:54.070 --> 00:12:03.720
Mark Johnson: Die Erkenntnisse, die an die Öffentlichkeit gelangen können, die Erkenntnisse, die sich etwas später am heutigen Tag zeigen werden, aber auch die Entscheidungen, die Sie beschleunigen können
00:12:03.940 --> 00:12:10.999
Mark Johnson: Und die Strategien, die Sie dann auf der Grundlage dieser Entscheidung aktivieren können. Herstellungsprozess
00:12:11.160 --> 00:12:17.809
Mark Johnson: Das passiert, wenn Ihre Mitarbeiter von einem Teil der betrieblichen Schwierigkeiten befreit werden, denen sie heute gegenüberstehen.
00:12:21.680 --> 00:12:31.099
Mark Johnson: KI ist für G. Treasury nichts Neues. Wie ich bereits erwähnt habe, gibt es traditionelle KI schon seit einigen Jahren, und
00:12:31.821 --> 00:12:39.810
Mark Johnson: Diese Tabelle zeigt einige Dinge, bei denen ich die allererste Transparenz zum Ausdruck bringen wollte.
00:12:40.170 --> 00:12:50.610
Mark Johnson: Während wir über verschiedene Lösungen innerhalb von G Treasury nachdenken. Wir möchten Ihnen genau sagen, welche Funktion die KI erfüllt.
00:12:51.190 --> 00:12:56.259
Mark Johnson: Welche Art von Modell verwenden wir spezifisch für KI,
00:12:56.380 --> 00:13:00.520
Mark Johnson: Und dann auch, welche Vorteile bringt es Ihnen?
00:13:00.780 --> 00:13:06.830
Mark Johnson: wenn wir am Beispiel von Liquiditätsprognosen unter Verwendung agentischer KI sprechen
00:13:07.260 --> 00:13:12.489
Mark Johnson: zur Entscheidungsfindung. Wir möchten, dass Sie wissen, was das bedeutet. Und wie funktioniert das?
00:13:13.020 --> 00:13:15.160
Mark Johnson: Das zweite große Ding ist
00:13:15.330 --> 00:13:24.290
Mark Johnson: Unser Ansatz und wie vielfältig er ist, wenn es darum geht, nicht jedem Problem ein KI-Modell aufzuzwingen.
00:13:24.770 --> 00:13:36.310
Mark Johnson: Wir wissen, dass sich statistische Modelle hervorragend für Vorhersagen eignen. Wir wissen, dass sich Fuzzy-Logik hervorragend für den Mustervergleich eignen kann.
00:13:36.870 --> 00:13:44.690
Mark Johnson: Wir wissen auch, dass sich agentische KI hervorragend für intelligente Entscheidungen, Unterstützung und Aktionen eignet.
00:13:44,810 --> 00:14:03.000
Mark Johnson: Also, wenn wir über die Lösungen innerhalb von G Treasury nachdenken. Wir sind sehr gewissenhaft bei der Anwendung des KI-Modells, das am besten geeignet ist, um eine Art von Aufgabe zu erledigen, die sich auflöst, die uns die Mühe nimmt und die Aufgabe in Ihrem Namen erledigt.
00:14:03.950 --> 00:14:08.810
Mark Johnson: Das Letzte, worauf wir uns ständig konzentrieren, ist
00:14:08.960 --> 00:14:22.719
Mark Johnson: Die Ergebnisse, wir investieren offensichtlich Zeit, um diese Lösung zu entwickeln. Und wir wollen sicherstellen, dass wir diese Zeit effektiv investieren. Und während wir über die möglichen Vorteile nachdenken.
00:14:22.780 --> 00:14:45.009
Mark Johnson: Diese sind nicht mehr nur theoretisch. Nun, das sind Vorteile. Wir sehen aus erster Hand, wenn es um die Genauigkeit von Prognosen geht, und verbessern uns, wenn es darum geht, Risikoszenarien in Minuten und nicht in Stunden zu simulieren. Wenn es um Integrationen geht, die sie früher in Anspruch genommen haben. Wochen können jetzt in Stunden erledigt werden.
00:14:45.160 --> 00:14:49.190
Mark Johnson: All dies ist ein echter, greifbarer Vorteil, der den Wert steigert.
00:14:49.470 --> 00:14:57.270
Mark Johnson: Diese Grundlage ist auch wichtig, weil sie der Höhepunkt von allem ist, was wir im Laufe der Zeit gelernt haben
00:14:57.540 --> 00:15:05.509
Mark Johnson: Und wie wir Intelligenz in die Treasury-Workflows eingebettet haben und gleichzeitig sehr darauf ausgerichtet sind.
00:15:05.610 --> 00:15:07.910
Mark Johnson: Was braucht dein Team eigentlich?
00:15:11.620 --> 00:15:13.199
Mark Johnson: Wahrscheinlich der Elefant im Zimmer
00:15:13.610 --> 00:15:28.680
Mark Johnson: Daten. Und offensichtlich liegt uns das sehr am Herzen. Es liegt dir sehr am Herzen. Aber der Schutz dieser Daten ist in erster Linie das wichtigste Prinzip, das wir haben, wenn wir über G. Smart nachdenken.
00:15:29.100 --> 00:15:32.360
Mark Johnson: Wir haben mit Hey, dein Vertrauen verdient
00:15:32.510 --> 00:15:39.040
Mark Johnson: erfordert mehr als nur Versprechen. Es erfordert einen soliden Architekturansatz.
00:15:39.250 --> 00:15:47.569
Mark Johnson: Es erfordert Governance, es erfordert Transparenz und was auf der gesamten Plattform passiert.
00:15:47.730 --> 00:15:51.980
Mark Johnson: Und wenn wir darüber nachdenken, mit der Datenseite zu beginnen.
00:15:52.090 --> 00:16:17.150
Mark Johnson: Wir wollen sicherstellen, dass, hey, Sie darauf vertrauen, wie wir die Lösung geschaffen haben. Alles beginnt mit Ihren Daten. Leben Sie in Ihrer eigenen Umgebung. Es gibt keine gemeinsame Verarbeitung. Es findet kein Austausch von Daten zwischen Mietern statt. Es gibt keinen mysteriösen Datensee, in dem Informationen vermischt werden könnten. Stellen Sie sich das so vor, als hätten Sie Ihre eigene private KI, auf der trainiert wurde
00:16:17.450 --> 00:16:21.390
Mark Johnson: Das Wissen der Welt, kann dann aber nur Ihre Daten sehen.
00:16:21.960 --> 00:16:32.249
Mark Johnson: Das zweite große Prinzip, dem wir gefolgt sind, ist die Tatsache, dass dies nur Inferenz ist. AI. Was heißt das? Es bedeutet, dass Ihre Daten
00:16:32.410 --> 00:16:34.719
Mark Johnson: wird nie zum Trainieren von Modellen verwendet.
00:16:35.350 --> 00:16:41.420
Mark Johnson: Wir stellen sicher, dass die KI ihre Intelligenz auf Ihre Daten anwendet, ohne daraus zu lernen.
00:16:42.510 --> 00:16:47.239
Mark Johnson: Ein weiterer wichtiger Aspekt ist die geografische Kontrolle.
00:16:47.510 --> 00:16:52.089
Mark Johnson: Wir betreuen Kunden auf der ganzen Welt. Wir wollen deine Daten
00:16:52.260 --> 00:16:57.590
Mark Johnson: in Ruhe, um in der von Ihnen ausgewählten geografischen Region in Ruhe zu bleiben.
00:16:57.760 --> 00:17:02.910
Mark Johnson: Ob das in den USA ist. Ob das in EMEA ist. Ob das in APAC ist
00:17:03.110 --> 00:17:09.520
Mark Johnson: Das geht darauf zurück, wie wir es von Anfang an eingerichtet haben, endlich Kontrolle
00:17:10.351 --> 00:17:38.769
Mark Johnson: visibility into what is taking place in the platform is is key as well as the outputs that are being delivered. So being able to showcase the dotted trails around those outputs to showcase why a a particular step was taken. And then the user involvement around working with that particular let's call it agent. Experience like that could exist within the platform
00:17:39.800 --> 00:17:47.799
Mark Johnson: much more we go into here, but definitely wanted to focus on hey? Top of mind for us always as we're building
00:17:49.720 --> 00:18:00.650
Mark Johnson: the other piece that we wanted to walk through and kind of sneak peek behind the hood is our own internal transformation at G. Treasury.
00:18:01.350 --> 00:18:19.169
Mark Johnson: You've probably heard me mention transformation. You've heard me mention journey, and that's because it it really is. We're all keeping abreast with what's going on in the market. What are new sources we want to tap into to learn. How do we continue to set up our teams for success? And as we think about
00:18:19.420 --> 00:18:25.750
Mark Johnson: this particular slide, these aren't just principles, but they're how we operate day to day
00:18:25.960 --> 00:18:31.069
Mark Johnson: and to kind of give you some some real tangible examples here.
00:18:31.260 --> 00:18:46.710
Mark Johnson: Our product team, Evan, myself, the rest of the team. We're using AI across different parts of our day to day workflow when it comes to how we think about writing product requirements for something new that we plan to develop
00:18:47.000 --> 00:19:07.470
Mark Johnson: how we are able to prototype designs again in minutes which would have taken weeks before. That allows us to get real time feedback from those of you who are on the call from our clients, our our prospects, our partners, that feedback allows us to move a lot faster, and then
00:19:07.780 --> 00:19:12.390
Mark Johnson: we can frankly use that time back to spend more time.
00:19:12.570 --> 00:19:21.820
Mark Johnson: better understanding where you have new problems that are there popping up. It's that shift from doing manual work to more strategic work.
00:19:22.560 --> 00:19:30.000
Mark Johnson: The other piece that has been a big amplifier for us is this, this culture of experimentation.
00:19:30.210 --> 00:19:50.189
Mark Johnson: and where we see a lot of value and benefit is the ability to run workshops, the ability to run hackathons, to have a thesis in mind so that we're not chasing every shiny object. You will hear a lot of companies building AI just to build AI.
00:19:50.620 --> 00:19:59.339
Mark Johnson: We don't want to be that company. We want to make sure that we are scaling something that actually works and actually solves a problem
00:20:00.250 --> 00:20:03.229
Mark Johnson: outcome which leads us to outcome driven innovation.
00:20:03.840 --> 00:20:22.950
Mark Johnson: We've developed our own framework on how we think about prioritizing use cases. And to give you an example there for us, is it a high frequency task that's being done by a number of of companies? Is it a high, painful task? And then
00:20:23.070 --> 00:20:35.210
Mark Johnson: can AI actually amplify that that experience, that process? So someone spending a day a week on forecast analysis could hit all 3 check check boxes.
00:20:36.200 --> 00:20:47.570
Mark Johnson: the last and definitely most important. Hey, we want to bring our customers along as a part of any of this experience, and we want to start with conversations. We want to start with
00:20:47.710 --> 00:20:51.679
Mark Johnson: an early access program. That is, that isn't just beta testing.
00:20:51.790 --> 00:21:04.560
Mark Johnson: But it's frankly co-creating the experience together. When a customer tells us, Hey, I need a board level view of these insights. They're not just giving feedback. They're helping us co-design as we go.
00:21:04.840 --> 00:21:05.680
Mark Johnson: So
00:21:05.870 --> 00:21:13.729
Mark Johnson: take these principles, adapt them, modify them as as best fit for for you and your company. And then.
00:21:14.311 --> 00:21:22.619
Mark Johnson: understand, it isn't all technology. It's also about, hey? Starting with conviction, starting with your team and and your culture as a company.
00:21:25.930 --> 00:21:33.159
Mark Johnson: So now we're gonna switch gears a little bit and we're gonna showcase what we've been working on.
00:21:33.500 --> 00:21:51.989
Mark Johnson: some of which is live, some of which is in flight and definitely has an opportunity to get early access candidates, giving us feedback along the way. And some of it's in that design stage, but wanted to showcase a few examples to make it real for for you guys
00:21:53.070 --> 00:22:02.229
Mark Johnson: to to level set here, as we think about G. Smart, there's 2 key components to keep in mind
00:22:03.040 --> 00:22:04.100
Mark Johnson: one.
00:22:04.300 --> 00:22:13.169
Mark Johnson: It is how we're thinking about agents, agents that are designed to complete a specific Treasury task
00:22:13.320 --> 00:22:24.959
Mark Johnson: agents that can reason through problems. They can discover patterns, and they can recommend an action all while keeping the team in the loop
00:22:25.320 --> 00:22:27.039
Mark Johnson: throughout that process.
00:22:27.540 --> 00:22:29.810
Mark Johnson: The second piece is.
00:22:30.090 --> 00:22:50.090
Mark Johnson: think of it as your control tower, your hub where it's not just a dashboard of what's taking place, but a single area of the platform where you can govern, you can create, you can set your own unique thresholds to any one experience.
00:22:50.520 --> 00:23:00.329
Mark Johnson: We obviously know that not all clients are treated equally. Everyone has their own policies, their own processes. This is where the hub starts to come into play
00:23:00.680 --> 00:23:13.069
Mark Johnson: without the Hub. Agents are just isolated tools, and could be powerful, but could be very disconnected from your processes. So you don't want that. At the same time.
00:23:13.200 --> 00:23:14.759
Mark Johnson: if you think about
00:23:14.870 --> 00:23:32.569
Mark Johnson: Wenn Sie nur einen Hub haben, möchten Sie nicht nur das Dashboard und keine Möglichkeit haben, Ihre eigenen Workflows zu orchestrieren. Die beiden Elemente kommen also zusammen, wenn wir über unsere Vision von G. Smart AI nachdenken, und werden dann zu einem wichtigen Bestandteil jeder Treasury-Transformation.
00:23:35.710 --> 00:23:45.559
Mark Johnson: G. Intelligente Prognoseeinblicke. Ich werde hier bewusst nicht zu viel von Evans Donner stehlen, da wir uns in einer Demo eingehend damit befassen werden. Aber
00:23:45.820 --> 00:23:59.860
Mark Johnson: Ich wollte ein bisschen zur Schau stellen, indem ich eine Geschichte darüber erzähle, wie das für uns angefangen hat. Also fiktiver Name. Wir verwenden Sarah als Leiterin des Finanzministeriums, die wahrscheinlich viele von Ihnen bei der Telefonkonferenz vertritt.
00:24:0.680 --> 00:24:04.110
Mark Johnson: Jeden, sagen wir, Donnerstag jeder Woche
00:24:04.270 --> 00:24:21.420
Mark Johnson: Sie durchläuft eine Routine. Sie erstellt ihren eigenen Prognosevergleichsbericht. Wahrscheinlich muss sie das nach Excel exportieren, um ihre eigenen Analysen durchführen zu können. Normalerweise geht sie Zeile für Zeile vor, um herauszufinden, was die größte Varianz ist?
00:24:21.770 --> 00:24:26.139
Mark Johnson: Worüber sollte ich besorgt sein? Was ist ungeklärt und was erklärt?
00:24:26.310 --> 00:24:37.650
Mark Johnson: Und dann muss sie das alles in eine Art Zusammenfassung fassen, die eine Zusammenfassung für ihr Führungsteam sein könnte, die für einen Manager sein könnte. Es könnte in einer Vorstandspräsentation verwendet werden.
00:24:38.340 --> 00:24:48.230
Mark Johnson: Abgesehen davon ist das ein manueller Prozess, der jede Woche für Sarah und dann für die Empfänger dieser Informationen mehrere Stunden in Anspruch nimmt.
00:24:49.680 --> 00:24:56.319
Mark Johnson: Wenn Sie an die Prognoseseiten von G. Smart denken, lautet unser Ziel: Wie reduzieren wir
00:24:56.480 --> 00:25:00.099
Mark Johnson: Aus dem Marathon ein 15-minütiger Sprint?
00:25:00.280 --> 00:25:03.620
Mark Johnson: Und das wird Evan gleich vorstellen.
00:25:05.460 --> 00:25:16.530
Mark Johnson: Der zweite Punkt, den wir hervorheben wollten, ist ein ähnlicher Ansatz wie unsere Risikomanagementlösung. Aber
00:25:16.970 --> 00:25:21.140
Mark Johnson: Ein anderer Anwendungsfall, wenn wir über Risiken nachdenken
00:25:21.750 --> 00:25:34.460
Mark Johnson: Risiko. Bei Richtlinien handelt es sich insbesondere um sehr lange Dokumente, die wahrscheinlich in mehreren Formaten vorliegen und sehr guten Inhalt haben, aber in einer statischen Form gefangen sind.
00:25:35.200 --> 00:25:40.940
Mark Johnson: Möglicherweise haben Sie Risiken, die nachverfolgt werden, und Excel-Tabellen.
00:25:41.200 --> 00:25:50.269
Mark Johnson: Möglicherweise haben Sie Ihre Richtlinie so eingerichtet, dass sie feststellt, wenn Sie einen Verstoß haben, aber vielleicht erfahren Sie erst Monate später von diesem Verstoß.
00:25:51.580 --> 00:25:55.650
Mark Johnson: Im Allgemeinen kommen Sie in einem Prozess viel zu spät. Also
00:25:56.070 --> 00:25:59.330
Mark Johnson: Während wir darüber nachdenken, KI hier anzuwenden.
00:25:59.750 --> 00:26:02.950
Mark Johnson: G. Intelligente Risiken, Erkenntnisse können zurückgehen
00:26:03.300 --> 00:26:24.769
Mark Johnson: Das spart Ihnen Zeit und hilft Ihnen bei der Entscheidungsfindung. Wir können den Einsatz von KI zum Lesen von Risikorichtlinien in Betracht ziehen, um Ihre Risiken kontinuierlich zu überwachen und Sie zu warnen, bevor es zu Verstößen kommt, und das alles in Echtzeit innerhalb der Plattform. Nicht nachdem dies passiert ist, sondern bevor es passiert.
00:26:24.970 --> 00:26:32.279
Mark Johnson: Und noch einmal, das ist einer der Bereiche, an denen wir jetzt anfangen zu arbeiten, und natürlich würden wir uns über Feedback freuen
00:26:32.540 --> 00:26:36.780
Mark Johnson: von denen, die am Anruf beteiligt waren. Während wir uns auf diese Reise begeben. Als Nächstes.
00:26:37.240 --> 00:26:43.990
Mark Johnson: Das dritte Stück, das wir präsentieren wollten, heißt unser G Smart Hub.
00:26:44.750 --> 00:26:57.190
Mark Johnson: Und, wie ich bereits erwähnt habe, stellen Sie sich das als eine Art Kontrollturm vor, Ihre Kommandozentrale, in der Sie sehen können, welche Agenten verfügbar sind.
00:26:57.590 --> 00:27:12.189
Mark Johnson: Sie können damit beginnen, herauszufinden, welche für Ihr Unternehmen sinnvoll sind, und dann können Sie den nächsten Schritt unternehmen, nämlich wie möchte ich sie für mein Unternehmen konfigurieren? Also, um Ihnen ein Beispiel aus der Praxis zu geben. Denk darüber nach
00:27:12.440 --> 00:27:15.760
Mark Johnson: Der Prozess zur Einreichung von Liquiditätsprognosen.
00:27:15.890 --> 00:27:23.340
Mark Johnson: Sie haben mehrere Geschäftsbereiche auf der ganzen Welt. An der Einreichung von Prognosen sind mehrere Personen beteiligt
00:27:23.490 --> 00:27:36.690
Mark Johnson: auf Hochfrequenzbasis. Was ist, wenn Sie die Person sind, die sie alle verfolgt? Nun, das macht keinen Spaß, E-Mails zu versenden. Sie erhalten Telefonanrufe, in denen versucht wird, alle dazu zu bringen, den Prozess zu durchlaufen. Du hast gesagt.
00:27:37.320 --> 00:27:48.109
Mark Johnson: Was wäre, wenn Sie einen Agenten haben könnten, der diese Maßnahmen in Ihrem Namen ergreift? Was wäre, wenn Sie es so konfigurieren könnten, dass es heißt: Hey, schau! Die Einreichung der Prognosen wird fällig
00:27:48.250 --> 00:27:51.100
Mark Johnson: jeden Freitag zu diesem Zeitpunkt jeder Woche.
00:27:51.320 --> 00:27:58.429
Mark Johnson: Und ich werde eine echte Zeit haben. Überblick darüber, wer bis Mitte der Woche eingereicht hat und wer nicht.
00:27:58.590 --> 00:28:00.250
Mark Johnson: und wenn Sie nicht eingereicht haben.
00:28:00.590 --> 00:28:14.970
Mark Johnson: Lassen Sie den Agenten Sie verfolgen und Sie daran erinnern, dass wir die vom Staat eingereichte Prognose benötigen, und dann können Sie kontinuierlich eine Momentaufnahme der Entwicklung, der abgeschlossenen Prognosen erhalten und so fahren
00:28:15.250 --> 00:28:42.540
Mark Johnson: a much more proactive behavior and giving you time back in your day to day. That's just one example of where you can start to control that experience to your own internal process. And then the second piece of it is okay. I can start to view other usage statistics across other agents. I can start to see the Roi firsthand
00:28:42.630 --> 00:28:49.879
Mark Johnson: of time savings that may be realized. Efficiency gains forecast accuracy, gains
00:28:50.210 --> 00:29:05.420
Mark Johnson: all of that in one place, and you can then follow what you want to do next. And maybe if I'm having success with this agent, I can go and think about this, this next use case and start to measure the Roi there
00:29:06.230 --> 00:29:17.139
Mark Johnson: again. This is this is where we're going, and and more to come on this one, and always for feedback as we as we co-design this with with an existing group of clients.
00:29:19.110 --> 00:29:28.719
Mark Johnson: So we're gonna switch gears again. And we're gonna open up another poll question. And as a part of this poll question
00:29:29.130 --> 00:29:32.960
Mark Johnson: I'll I'll have Evan. Then jump into the demo
00:29:33.931 --> 00:29:37.550
Mark Johnson: after the demo. We will leave some time for Q&A at the end.
00:29:45.230 --> 00:29:53.710
Mark Johnson: The question is, in which areas would your organization like to raise the bar for forecasting? And you can check multiple answers.
00:31:00.480 --> 00:31:04.439
Evan Ryan: I think we might give it one more, one or 2 more seconds on the
00:31:04.610 --> 00:31:09.270
Evan Ryan: those answers should be popping up perfect.
00:31:10.210 --> 00:31:13.250
Evan Ryan: Okay, so in which areas
00:31:14.316 --> 00:31:17.679
Evan Ryan: would your organization like to raise the bar for forecasting
00:31:18.739 --> 00:31:28.300
Evan Ryan: more advanced methods can see coming in at 24% better explanations required, and
00:31:28.500 --> 00:31:31.899
Evan Ryan: you can see less tolerance for errors at 11%.
00:31:33.120 --> 00:31:39.439
Evan Ryan: But just to call out the the better explanations required coming in at 27%. The highest
00:31:40.146 --> 00:31:42.280
Evan Ryan: are the more advanced methods
00:31:42.410 --> 00:31:58.379
Evan Ryan: at 24%. You know, that really does feed into the demo that I'll actually be jumping into now really focusing on the you know better explanations required so highlighting those key insights in a
00:31:59.210 --> 00:32:00.860
Evan Ryan: AI agentic manner
00:32:01.020 --> 00:32:16.189
Evan Ryan: and more advanced methods, there's some really cool data visualizations that I'm really excited to to show you today. So with that, I'll start sharing my screen here, Mark and I'll jump into the demo
00:32:22.690 --> 00:32:23.710
Evan Ryan: perfect.
00:32:24.746 --> 00:32:30.449
Evan Ryan: So here within GtTreasury, forecasting within our reporting suite.
00:32:31.327 --> 00:32:38.569
Evan Ryan: So, as Mark mentioned, you know, we're deploying AI across the G Treasury platform
00:32:39.353 --> 00:32:46.819
Evan Ryan: initially within G. Treasury forecasting and specifically within the G Treasury forecasting suite itself.
00:32:47.240 --> 00:32:52.459
Evan Ryan: So what we're looking at here is the landing page for the comparison report
00:32:53.190 --> 00:33:02.239
Evan Ryan: the comparison report compares 2 separate versions or snapshots of your forecast.
00:33:02.490 --> 00:33:10.630
Evan Ryan: In this instance I have my latest submission. So again, as Mark was talking about the G smart Hub.
00:33:11.334 --> 00:33:21.839
Evan Ryan: and that Treasury analyst preparing their submissions. Let's say that submission is prepared and finalized on that Thursday, and then that user then wants to compare
00:33:22.000 --> 00:33:31.179
Evan Ryan: the version that they've just prepared. Compare that, then, to their previous version, and then to dig into the variances in that report.
00:33:31.340 --> 00:33:33.910
Evan Ryan: So actually just run the report here.
00:33:35.800 --> 00:33:41.400
Evan Ryan: I have my report here with my forecast versus actuals and my forecast versus forecast.
00:33:41.680 --> 00:33:45.019
Evan Ryan: and I've grouped it by business unit.
00:33:45.490 --> 00:34:03.829
Evan Ryan: One thing I want to call out is that initial new feature that we have here? So you can see a spotlight panel that I can expand upon, and that's straight away, highlighting key variances that are surfaced within that report. So you know.
00:34:04.070 --> 00:34:12.650
Evan Ryan: we're talking about really reducing that toil and straight away you can see that this is really delivering value.
00:34:12.800 --> 00:34:16.739
Evan Ryan: So in this case there are 4 hidden cash flow differences that are uncovered.
00:34:17.179 --> 00:34:21.800
Evan Ryan: Firstly, we have a closing balance variance of a little over
00:34:22.110 --> 00:34:30.370
Evan Ryan: half 1 million dollars, calling out that balance between that forecast versus actuals piece than the largest negative variance.
00:34:30.510 --> 00:34:33.860
Evan Ryan: the largest positive variance, and then
00:34:34.020 --> 00:34:56.489
Evan Ryan: 2 new metrics that we're introducing as well. So smape and wmape really focusing on the accuracy of your forecast. So wmape is the weighted version really focusing on looking at the big ticket items and smape, looking at each line item in this case at an individual weighted level.
00:34:56.820 --> 00:35:16.689
Evan Ryan: and to interpret this. So the lower both of these figures are the better. But just to interpret what I'm looking at here, it looks like, because this W. Map is lower. I'm better at forecasting the bigger ticket items, and than I am at forecasting the smaller ticket items.
00:35:17.390 --> 00:35:38.680
Evan Ryan: I can click on this. I can see a bit more of an explainer here. And also we've embedded a helpful guide that goes into a bit more from a mathematical standpoint with the different formulas that we're using and how to actually interpret it, the pros and cons of the 2 different metrics.
00:35:38.920 --> 00:35:45.009
Evan Ryan: and, as I said, how to interpret your metrics, and then tips on how to improve your forecast
00:35:45.200 --> 00:35:46.439
Evan Ryan: going forward.
00:35:46.990 --> 00:35:50.350
Evan Ryan: So with that I'll generate the insights.
00:35:50.540 --> 00:35:53.590
Evan Ryan: And so, as I said, you know.
00:35:53.790 --> 00:35:59.869
Evan Ryan: straight away, I'm seeing great value from G smart, but I can, you know.
00:36:00.400 --> 00:36:05.645
Evan Ryan: do a deeper dive of my variance report here, and
00:36:06.910 --> 00:36:14.979
Evan Ryan: I can see from my tooltip here. So it's doing a number of things and evaluating the variance
00:36:15.560 --> 00:36:29.589
Evan Ryan: materiality thresholds. So it's preparing that forecast assessment, that executive summary that Mark was talking about a couple of moments ago, and then really will lead into the different sections of the report.
00:36:30.180 --> 00:36:33.060
Evan Ryan: And then, you know, based off of that
00:36:33.520 --> 00:36:47.470
Evan Ryan: question that was posed to you a couple of months ago. The on that poll question, a couple of cool visualizations that I I want to show you today.
00:36:48.410 --> 00:36:52.889
Evan Ryan: So and it's not just in the comparison report. This
00:36:53.060 --> 00:36:59.099
Evan Ryan: insights is actually also available in the Consolidation Report, which I'll show you in a couple of moments.
00:37:00.580 --> 00:37:09.970
Evan Ryan: So straight off the bat I can see what 2 submissions are being compared, and then the deep dive
00:37:10.556 --> 00:37:24.639
Evan Ryan: in the actual analysis. So I can look here at servicing the executive summary. So a high, level overview of the actual report that I sent to the AI model to be analyzed.
00:37:24.880 --> 00:37:32.540
Evan Ryan: I'm calling out the opening balance, the receipts, and then there are a number of key areas that I want to call out.
00:37:32.710 --> 00:37:41.239
Evan Ryan: firstly, the receipts, variance analysis. So those favorable variances and then unfavorable variances.
00:37:41.360 --> 00:37:47.629
Evan Ryan: and then the same side on the payments side as well. So those payment variance analysis.
00:37:49.230 --> 00:37:55.959
Evan Ryan: There's a table here for my top, 5 variants, so I can see my intercompany line item
00:37:56.170 --> 00:38:04.010
Evan Ryan: in the Ireland business unit had a variance of 6.7 million dollars. In this specific period
00:38:05.010 --> 00:38:23.699
Evan Ryan: a really exciting new feature or new part of this feature is the areas to investigate and act. And so, as Mark mentioned, you know, this really does save a lot of time. So you can see within a couple of moments. I've already generated an executive level summary report.
00:38:24.343 --> 00:38:34.089
Evan Ryan: I can easily copy this out, paste it into a an email. Send that to my manager to send that to the Cfo.
00:38:34.660 --> 00:38:40.080
Evan Ryan: But also highlighted here is that areas to investigate and act, and
00:38:40.350 --> 00:38:52.387
Evan Ryan: to really turn around that forecast accuracy and that you're seeing here. So in this case, 15.3% and really surfing, surfacing those insights.
00:38:53.110 --> 00:39:04.589
Evan Ryan: and no longer having to, you know. Dig through this report and go through that toil. It's already surfaced here so that you can quickly improve your forecast accuracy.
00:39:05.250 --> 00:39:13.779
Evan Ryan: I can also interact with the report here and give it a thumbs up and a thumbs down, and so that this report would be
00:39:14.220 --> 00:39:19.140
Evan Ryan: provided to you. You know, improved the next time you use it.
00:39:19.530 --> 00:39:29.789
Evan Ryan: So, as I said here, you know already I'm seeing great value from the spotlight panel. Those key variances are surfaced straightaway.
00:39:30.000 --> 00:39:37.640
Evan Ryan: and then once I click that generate insights button, I can see an executive summary level report is created here.
00:39:39.170 --> 00:39:43.730
Evan Ryan: but I can actually do a deeper dive on that
00:39:43.850 --> 00:39:48.389
Evan Ryan: on that data, on my report. So I can see a number of questions here.
00:39:48.640 --> 00:39:55.360
Evan Ryan: We've built up a bank of questions. I'm working with a an Sme group.
00:39:55.510 --> 00:40:07.040
Evan Ryan: and essentially the Llm. The AI. Is suggesting, based off of the content of this report. What questions best suit
00:40:07.380 --> 00:40:08.519
Evan Ryan: this report?
00:40:08.720 --> 00:40:11.780
Evan Ryan: So in this case. I'm going to ask.
00:40:11.970 --> 00:40:18.870
Evan Ryan: And AI, so what are my top? 5 closing balance variances by business unit?
00:40:19.250 --> 00:40:42.909
Evan Ryan: And essentially what this will do is generate a graph with a narrative attached to that graph here. So again, I've done this previously as well in previous roles, and I'm sure a lot of people on this call have done this where you're generating these graphs within excel, and you're picking different columns. But you can see how quickly
00:40:43.020 --> 00:40:45.020
Evan Ryan: this graph was generated.
00:40:45.580 --> 00:40:55.869
Evan Ryan: Again, I can copy this out individually, but what I would actually like to do is, I would like to add this to my report, and I can generate a final report
00:40:56.010 --> 00:40:57.000
Evan Ryan: at the end.
00:40:57.770 --> 00:41:04.420
Evan Ryan: So I'm going to ask a couple of more questions here. So how is my forecast accuracy trending?
00:41:04.930 --> 00:41:05.880
Evan Ryan: And
00:41:06.040 --> 00:41:18.169
Evan Ryan: so at a specific business unit level. And again, I'm going to get a graph that I can, you know, is quickly generated with a narrative. I could add that to my report.
00:41:18.330 --> 00:41:25.210
Evan Ryan: and in this case I'm wondering, you know, which business units at least accurate.
00:41:26.910 --> 00:41:47.139
Evan Ryan: So again, you know something that would take you know, time to download this report in excel imported, pull out my specific tables, build this in, excel, you know, quickly generate it, and I can add this to my report. So now that I have my executive summary report up top.
00:41:47.480 --> 00:41:52.179
Evan Ryan: and I've run my 3 different questions. But as if
00:41:52.680 --> 00:41:59.320
Evan Ryan: you'll note there, I've tagged each of them to be generated or to be included in a final report.
00:42:00.010 --> 00:42:09.809
Evan Ryan: So, rather than just generating a report where those 3 visualizations are kind of tagged on to the
00:42:10.280 --> 00:42:26.060
Evan Ryan: top summary, a cohesive narrative is actually created. So again, the AI is sent that 1st executive summary and those 3 reports, and is essentially prompted.
00:42:26.170 --> 00:42:27.840
Evan Ryan: and to be told.
00:42:28.000 --> 00:42:50.220
Evan Ryan: create a cohesive summary, a cohesive narrative based off of the executive summary and your 3 additional insights. And really, you know again. This is a fantastic time saver for users rather than having to go in, and, you know, adjust and update the narrative in the executive summary, and also
00:42:50.790 --> 00:43:04.839
Evan Ryan: the AI is prompted to disperse those visualizations as it best sees fit, and to, you know, ensure that there is a complete narrative. On the whole report.
00:43:05.429 --> 00:43:09.379
Evan Ryan: You know, and again, you know, users can export this to
00:43:10.240 --> 00:43:20.130
Evan Ryan: so that they can easily send this on in a board deck for for reporting, so I can see my executive summary is still here.
00:43:20.694 --> 00:43:21.935
Evan Ryan: You know. But
00:43:22.520 --> 00:43:32.100
Evan Ryan: I can see it's now, you know, focusing on it now knows that there is a business unit with the lowest frequency chart. So if I was to view the initial summary
00:43:32.240 --> 00:43:34.089
Evan Ryan: that wouldn't actually be there.
00:43:34.621 --> 00:43:46.259
Evan Ryan: Because, okay, so it's input this top 5 business unit by closing balance variance here again, not just tagging it on at the bottom, but creating that cohesive narrative.
00:43:47.282 --> 00:43:49.889
Evan Ryan: I can see my receipts, variance analysis.
00:43:50.716 --> 00:43:55.190
Evan Ryan: my payments, variance analysis. And then that forecast accuracy as well.
00:43:55.790 --> 00:44:05.690
Evan Ryan: So that's the forecast insights from the comparison report. I'm going to jump into the Consolidation report here.
00:44:05.850 --> 00:44:20.939
Evan Ryan: and I'll run my report. And again that consolidation report really is that Consolidated Bird's eye view of all of the different business units that I have in my system, in one cohesive view from a forecasting perspective.
00:44:21.340 --> 00:44:24.160
Evan Ryan: So again, I'm greeted with my spotlight panel.
00:44:24.860 --> 00:44:29.910
Evan Ryan: In this instance I can see there are 3 hidden cash flow differences uncovered.
00:44:30.060 --> 00:44:43.319
Evan Ryan: 1, st one is calling out the business units that are holding the most cash. So what business units are cash rich in this instance? So I can see the Uk. Canada and Netherlands.
00:44:44.390 --> 00:44:49.589
Evan Ryan: and very importantly as well what business units are experiencing.
00:44:50.228 --> 00:44:52.019
Evan Ryan: You know, short liquidity.
00:44:52.250 --> 00:45:00.899
Evan Ryan: Okay? So in this case there are 10 business units that are experiencing short liquidity. And the 3rd piece, then, is an overview of how my forecast
00:45:01.840 --> 00:45:08.990
Evan Ryan: is a going to basically trend over the next number of weeks. In this case, 13 weeks.
00:45:09.100 --> 00:45:17.300
Evan Ryan: I'm calling at the highest expected range over that week, those number of weeks so similar to the
00:45:17.966 --> 00:45:21.540
Evan Ryan: Comparison report. I'm going to generate my insights.
00:45:23.070 --> 00:45:45.850
Evan Ryan: you know, and as a user. You can really see the benefit of G. Smart here, straight off the bat again in the Consolidated report with that spotlight panel. Traditionally, users would have to download this in. Excel, start to go through it. Surface. Those, let's say, 3 business units that are cash, rich cash poor.
00:45:46.220 --> 00:45:58.550
Evan Ryan: whereas you know you can see straight away. I'm surfacing that information and but also again, like the Comparison report going into a deep dive analysis of the Consolidation report here.
00:45:59.160 --> 00:46:06.309
Evan Ryan: you know, obviously focusing on it from a liquidity perspective. Okay? So I have my executive summary
00:46:06.460 --> 00:46:22.960
Evan Ryan: and my current liquidity position. So in this case I can see I have 23.4 days of cash. So what's my starting balance? And what's my daily cash outflow? So in this instance, okay, I know I have 23.4 days of cash.
00:46:23.673 --> 00:46:37.219
Evan Ryan: Calling up my cash forecast. How that's looking over this 13 week period, and then the liquidity risk. So what business units are at risk from liquidity, perspective?
00:46:37.420 --> 00:46:44.740
Evan Ryan: What period does that call to, and the actual liquidity position for each of those business units.
00:46:45.630 --> 00:47:01.760
Evan Ryan: and similar to the comparison report highlighting those areas to investigate and act. So again, no longer having to dig through excel once you've exported this report. That's highlighted straight away so you can take, you know. Action.
00:47:02.292 --> 00:47:04.110
Evan Ryan: You know, straight off the bat
281
00:47:04.690 --> 00:47:25.460
Evan Ryan: again. I can copy this out. I can give it feedback, give it. A thumbs up, thumbs down, and you know, as I said, with the comparison report, consolidation report straight away. I'm getting great insights that I can easily send to senior management for reporting. But also I'm presented with a
00:47:25.580 --> 00:47:31.480
Evan Ryan: in this case 3 questions from a bank of questions that we've built up, that again, the
00:47:31.620 --> 00:47:38.869
Evan Ryan: AI is suggesting best fits the actual data in your graph or in your report here.
00:47:39.160 --> 00:47:44.389
Evan Ryan: So in this case, I want to know. Let's say, what business units
00:47:44.530 --> 00:47:48.120
Evan Ryan: are projected to run risk running out of cash.
00:47:49.340 --> 00:48:03.879
Evan Ryan: So again, similar to the comparison report, I'm going to be presented here with a table and and a narrative to go along with that table as well. So again say I want to add this to my report.
00:48:05.095 --> 00:48:09.319
Evan Ryan: Which, and let's say which business units have the highest cash position.
00:48:09.870 --> 00:48:12.897
Evan Ryan: And so here I I'm kind of
00:48:13.450 --> 00:48:17.840
Evan Ryan: told at a high level. In this case 10 business units and
00:48:19.800 --> 00:48:29.520
Evan Ryan: at expected to fall below the liquidity. And here we're calling it those top 5. Okay? So in this case I can see the United Kingdom.
00:48:31.110 --> 00:48:41.470
Evan Ryan: has the sorry in here. Yes, the the largest cash position. Here. We can see that the United Kingdom has the highest cash position, so I can add this to my report.
00:48:42.093 --> 00:48:46.976
Evan Ryan: And say, you know what business units are contributing most to
00:48:47.630 --> 00:48:58.589
Evan Ryan: Monster Cache Burn, so similar to the previous visualizations. I'm again presented with a table here and a narrative to go along with it.
00:48:58.760 --> 00:49:04.880
Evan Ryan: so I can add this to my final report, and I'm going to now request a final report.
00:49:05.370 --> 00:49:10.130
Evan Ryan: So, as I said with the comparison report here
00:49:10.580 --> 00:49:18.839
Evan Ryan: the Consolidation report, is sent to the AI, and then that executive summary is generated. I've asked.
00:49:19.180 --> 00:49:27.809
Evan Ryan: 3 insightful questions. And those insights are raised here and again those graphs
00:49:27.990 --> 00:49:53.869
Evan Ryan: and the narrative associated with them. They're not just appended to that executive summary up top. They're incorporated into the overall flow of the actual executive summary. So you know, again, saving time rather than having to go in and adjust the actual. You know executive summary. It intersperses those insights where it best fits, so that there's a cohesive narrative.
00:49:54.790 --> 00:50:01.450
Evan Ryan: So I can see here my business units with highest cash cash position and calls out, then the cash
00:50:01.780 --> 00:50:04.960
Evan Ryan: forecast. My average cash flows.
00:50:05.860 --> 00:50:19.169
Evan Ryan: my average cash outflows per business unit. And then my liquidity risk as well. And again, if I was to, kind of, you know, take a look through the narrative here again. It's going to tweak that nerve so that there is that
00:50:19.470 --> 00:50:26.960
Evan Ryan: cohesive narrative from a reporting perspective. Again, I can copy this out, put it into a board pack
00:50:27.340 --> 00:50:32.600
Evan Ryan: prepared for a deck that I can, you know, saves me a lot of time and and toil.
00:50:33.590 --> 00:50:38.799
Evan Ryan: So with that I'll stop sharing. I'll
00:50:41.013 --> 00:50:49.750
Evan Ryan: we'll now move into the question and answer section of the of the webinar today.
00:50:51.180 --> 00:50:58.759
Evan Ryan: And we just have A. So if you have any questions, you can enter them in the Q&A box.
00:50:59.660 --> 00:51:06.380
Evan Ryan: And so a couple of questions here. So the 1st one are users able to create forecast insight questions.
00:51:06.885 --> 00:51:30.040
Evan Ryan: So at the moment we have a bank of questions that we've created working with a group of Sme treasure users. But you know, if you are using the system and if there is feedback there that you want to. You know, there's, I suppose, multiple ways that we can receive feedback from a product perspective.
00:51:30.606 --> 00:51:32.540
Evan Ryan: One is within that feedback.
00:51:33.089 --> 00:51:45.659
Evan Ryan: Functionality. And if there are users that are, you know, requesting questions quite regularly. Then certainly we can look at adding those questions to that bank, of questions.
00:51:51.680 --> 00:51:56.460
Mark Johnson: Yeah, maybe I'll I'll it's a good question. We saw another question. Similar
00:51:56.830 --> 00:52:25.349
Mark Johnson: framework on just hey? If I have my own questions or I want to see more suggestions to Evan's point, definitely wanting to build that bank even further. So as we get more users in it where where we can be pretty responsive and and building more out there. Another question we had was around estimated data deployment for G. Smart. So what Evan just demo today is available for any cash forecasting
00:52:25.380 --> 00:52:31.090
Mark Johnson: customer. And we can help you guys with getting that enabled. And we'll have
00:52:31.140 --> 00:52:40.429
Mark Johnson: kind of a next step slide right after this. But then we are currently producing what we showed with risk and the hub
00:52:40.490 --> 00:52:54.849
Mark Johnson: and working through what that delivery date looks like this year as well, but also an an early access program there. So if those were of interest, then definitely, please reach out and we will make sure you're a part of of both of those programs, too.
00:52:58.034 --> 00:53:22.509
Evan Ryan: I see another question here. What controls are in place to verify the accuracy of the AR reporting great question. And you know a question that we've spent a lot of time on from a testing perspective. And so you know, the the key focus for us from a accuracy perspective is ensuring that the the figures within the report are correct.
00:53:22.750 --> 00:53:50.200
Evan Ryan: Within those insights are correct. There is a number of ways to approach this, but ultimately what we've done within the AI Middleware is to set up a golden data set, and we can then use the AI as a judge using Llm. As a judge. Essentially, you're training. You're ensuring that the answers that come out essentially match
00:53:50.840 --> 00:54:07.389
Evan Ryan: the input and so within the prompting as well, there are a lot of guardrails that are implemented there. So you know, to really focus on the accuracy of the actual figures, and to reduce any hallucinations.
00:54:09.270 --> 00:54:29.009
Mark Johnson: Another question around additional costs. Are there additional costs to G. Smart, if you're already a cash analytics customer. So for those who already have cash forecasting. There's no additional cost for what we just demoed our priority with. That experience is driving adoption and learning, and frankly improving it as we go.
00:54:29.290 --> 00:54:35.180
Mark Johnson: and for now there's no plans to to charge extra for that particular experience.
00:54:43.210 --> 00:54:50.710
Evan Ryan: Yeah. So I see. Another question here will AI be integrated with the trend forecast functionality in the future.
00:54:50.880 --> 00:54:55.116
Evan Ryan: And so currently, the plan. As Mark mentioned,
00:54:55.850 --> 00:55:04.069
Evan Ryan: during his presentation. The plan is currently to implement AI within due treasury risk.
00:55:04.260 --> 00:55:31.290
Evan Ryan: So apply those same forecasting insights that you saw here, but from a risk perspective, and then the hub as well. But additionally, then, towards the you know, in the next couple of months we'll be looking for different areas within the actual tool within forecasting and obviously within the G Treasury platform, where we can uplift the current functionality so we can enable AI there as well.
00:55:34.220 --> 00:55:57.202
Mark Johnson: The controls is a great question. So what controls are in place to verify the accuracy of the AI reporting? So I I can start, and then Evan can definitely jump into. So there's a lot that's frankly where a lot of the work comes into play to make sure. Hey, what you guys see in the insights panel is exactly reflective of your data within G treasury.
00:55:57.540 --> 00:56:09.940
Mark Johnson: And we do that in a couple of different ways. Number one, we use multiple AI models in the process. So think of it as not only is is a model involved in the
00:56:10.370 --> 00:56:35.200
Mark Johnson: creation of that insights panel, but also another model involved in the review of that information. So we've got extra checks and balances there. We've also got kind of like that preliminary work when it comes to setting up the appropriate prompting, setting up the appropriate evaluation standpoint of all responses that are generated. And then another component is.
00:56:35.250 --> 00:56:42.529
Mark Johnson: we have real time visibility into the outputs and making sure. Hey, we have our own
00:56:43.140 --> 00:56:45.310
Mark Johnson: accuracy measurement in real time.
00:56:45.420 --> 00:56:59.920
Mark Johnson: Und wir können dem folgen und darüber hinaus auch sehen. Evan erwähnte das Feedback-Panel mit den Daumen hoch, den Daumen runter und den Kommentaren, sodass wir direkt alles sehen können, was eingereicht wird, und natürlich entsprechend darauf reagieren können.
00:57:00.180 --> 00:57:01.639
Mark Johnson: Evan. Irgendetwas anderes.
00:57:01.640 --> 00:57:21.220
Evan Ryan: Nein, nein, du hast den Nagel auf den Kopf getroffen, wie ich schon früher gesagt habe, weißt du, wie du weißt, verwenden wir. Dann dieser Lom als Richter. Also das andere KI-Modell verwenden, um im Grunde zu beurteilen und sicherzustellen, dass Sie wissen, wie gut aussieht, und wieder, das wird innerhalb der
00:57:21.850 --> 00:57:26.359
Evan Ryan: KI-Service, damit wir sicherstellen, dass diese Erkenntnisse korrekt sind.
00:57:26.880 --> 00:57:33.980
Evan Ryan: Und ich sehe, hier gibt es noch eine weitere Frage dazu, wie wir sicherstellen, dass der Einblick
00:57:34.260 --> 00:57:47.010
Evan Ryan: Erkenntnisse ignorieren bestimmte Eingaben aus dem Bericht oder aus Sicht der Berichterstattung? Der Schlüssel dazu ist, Sie wissen schon, wirklich auf das abzuzielen, was Sie eingeben und in den
00:57:47.130 --> 00:57:56.560
Evan Ryan: Bericht aus der Sicht der Parameter. Sie wissen also, dass Benutzer den Bericht im Wesentlichen auf eine Vielzahl verschiedener Arten konfigurieren können. Also.
00:57:56.983 --> 00:58:18.620
Evan Ryan: Wissen Sie, ich hatte Telefonate mit einem unserer Early-Access-Programmbenutzer, in denen ich mich erkundigte, wie ich bestimmte Einzelposten oder Geschäftsbereiche ausschließen kann, aber Sie wissen, dass das einfach im Parameterbereich gehandhabt werden kann, indem Sie diese Elemente einfach abwählen, sodass der Bericht nicht wirklich abgerufen wird. An erster Stelle.
00:58:25.120 --> 00:58:46.139
Mark Johnson: Sieht nach ein paar Fragen dazu aus, wie wir über die Anwendung von G. Smart im Liquiditätsmanagement und Cashmanagement denken, und das ist definitiv ein Teil des Prozesses. Ich denke, das geht darauf zurück, wie wir beim Thema Risiko gelandet sind, und das war der nächste Bereich, der hauptsächlich auf Kundenfeedback zurückzuführen ist.
00:58:46.290 --> 00:59:13.600
Mark Johnson: Nun, wir wenden den gleichen Ansatz für Liquidität, Planung und andere Teile der Plattform an. Ihr habt also Ideen und Anwendungsfälle, weil ihr Interessen habt und seht, was heute gezeigt wurde und wie das auf andere Workflows direkt auf der Plattform angewendet werden könnte. Nun, wir haben definitiv ein offenes Ohr dafür. Und auf der nächsten Folie werden Sie sowohl meine Kontaktinformationen als auch Evans Kontaktinformationen sehen.
00:59:16.710 --> 00:59:17.470
Evan Ryan: Und.
00:59:17.470 --> 00:59:18.140
Mark Johnson: Damit. Vielleicht.
00:59:18.140 --> 00:59:18.580
Evan Ryan: Mach weiter!
00:59:18.580 --> 00:59:21.189
Mark Johnson: Noch eine Frage, und dann springen wir zum letzten.
00:59:21.190 --> 00:59:28.999
Evan Ryan: Ja, ja, ich wollte nur sagen, ich sehe, hier gibt es eine Art von Frage. Wie prognostiziert man die erste Woche, wann
00:59:29.625 --> 00:59:44.620
Evan Ryan: AR und Ap schließen ihr Hauptbuch in ihrem ERP. Das könnte etwas sein, das vielleicht außerhalb dieses Bereichs liegt, aber speziell aus der Smart-Ledger-Perspektive. Dort befinden sich die AR- und AP-Daten
00:59:46.100 --> 01:00:01.820
Evan Ryan: Lösung. Und dann können Sie Zuordnungsregeln verwenden, um diese AR- und AP-Daten dem zuzuordnen. Sie kennen die erste Woche Ihrer Prognose. Und nur ja, wie Mark schon sagte, ich bin mir der Zeit hier bewusst. Also ich denke, es macht Sinn, zur letzten Folie überzugehen.
01:00:02,960 --> 01:00:08,800
Mark Johnson: Ja. Also schau, ich weiß es wirklich zu schätzen. Nehmt ihr heute eine Stunde mit uns
01:00:08.960 --> 01:00:26.730
Mark Johnson: Ich hoffe, das ist das große Ziel, mehr darüber zu erfahren, was im Büro des CFO passiert. Es war hilfreich, wie wir als Unternehmen darüber nachdenken, sowohl intern aus kultureller Sicht, als auch mit G. Smart als Teil unserer Plattform
01:00:26.880 --> 01:00:46.830
Mark Johnson: und zögern Sie nicht, ein Foto vom QR zu machen. Code, in dem Sie direkt mehr über G. Smart erfahren können. Gleichzeitig sind sowohl meine Kontaktinformationen als auch Evans Kontaktinformationen unten aufgeführt. Wenn wir Ihre Frage nicht beantwortet haben, werden wir sicherstellen, dass sie auch individuell beantwortet wird.
01:00:47.080 --> 01:00:52.489
Mark Johnson: Also nochmal, danke euch für die Teilnahme. Danke für die wirklich tollen Fragen.
01:00:52,920 --> 01:00:55,970
Mark Johnson: und ich freue mich darauf, auf dieser Reise zusammenzuarbeiten.
01:00:57.160 --> 01:00:59.480
Evan Ryan: Danke. Leute, habt einen schönen Rest eures Tages.
Wir bringen Klarheit in die KI im Finanzbereich: Wir stellen vor: GSmart
KI verändert die Spielregeln im Finanzwesen, aber die meisten Lösungen sind nicht für die besonderen Anforderungen des Finanzministeriums konzipiert. Black-Box-Modelle, generische Plattformen und unverbundene Tools werfen mehr Fragen als Antworten auf.
Deshalb hat Ripple Treasury gebaut GSmart, die einzige Treasury-spezifische KI-Lösung.
Sehen Sie sich eine Aufzeichnung unseres letzten Webinars an,“Wir bringen Klarheit in die KI im Finanzbereich: Wir stellen vor: GSmart„, um zu sehen, wie speziell entwickelte KI Einblicke in Echtzeit, intelligente Automatisierung und erklärbare Ergebnisse liefern kann.
Transkript
00:00:14.130 --> 00:00:24.260
GTreasury Marketing: Hallo zusammen, und danke, dass Sie heute zu uns gekommen sind. Wir werden in ein paar Minuten beginnen, um allen unseren Teilnehmern Zeit zu geben, am Webinar teilzunehmen. Also bleiben Sie ruhig und wir werden in Kürze beginnen.
00:01:27.300 --> 00:01:37.979
Treasury Marketing: Okay, hallo, alle zusammen. Vielen Dank, dass Sie heute an unserem Webinar teilgenommen haben, das Klarheit in Sachen KI bringt und G. Smart vorstellt. Lassen Sie uns ein paar Dinge rund um die Haushaltsführung besprechen, bevor wir beginnen.
00:01:39.800 --> 00:01:59.430
GTreasury Marketing: Die heutige Veranstaltung wird voraussichtlich eine Stunde dauern, einschließlich Zeit für Fragen. Am Ende sind alle Teilnehmer stummgeschaltet. Wenn Sie während der Präsentation zu irgendeinem Zeitpunkt Fragen haben, geben Sie diese bitte in den Q&A-Bereich auf Ihrer Zoom-Steuerleiste ein. Dieses Webinar wird aufgezeichnet und ein Link zur Aufzeichnung wird per E-Mail an alle Teilnehmer gesendet.
00:02:01.710 --> 00:02:08.490
Treasury Marketing: Unsere heutigen Redner sind Evan Ryan und Mark Johnson. Deshalb werde ich es ihnen für eine kurze Einführung übergeben.
00:02:09.710 --> 00:02:31.199
Evan Ryan: Vielen Dank. Schön, heute hier bei euch zu sein. Mein Name ist Evan Ryan. Ich bin Produktmanager hier im Finanzministerium und spezifiziere mich auf Liquiditätsprognosen. Ich werde heute am Ende der Präsentation mit der Demo beginnen und freue mich sehr, Ihnen zeigen zu können, woran wir in den letzten Wochen gearbeitet haben
00:02:31.320 --> 00:02:32.459
Evan Ryan: Zu dir, Mark.
00:02:33.210 --> 00:02:55.960
Mark Johnson: Fantastisch. Danke, Evan. Also nochmal, heiße alle willkommen. Ich bin Mark Johnson, Chief Product Officer bei G. Treasury. Ich leite unsere globalen Produktmanagement-Design- und Quantteams. Ich habe den größten Teil meiner Karriere an dieser Schnittstelle von Finanzen und Technologie verbracht, von Zahlungen und Ressourcenmanagement bis hin zu Finanzautomatisierung und Gehaltsabrechnung
00:02:56.090 --> 00:03:06.140
Mark Johnson: Ich freue mich sehr, heute mit Ihnen zusammen zu sein und darüber zu sprechen, wie wir Treasury-Teams wie Ihnen helfen können, einem Teil der manuellen Arbeit zu entkommen, von der wir wissen, dass wir alle damit umgehen müssen.
00:03:06.820 --> 00:03:11.649
Mark Johnson: Damit werden wir uns auf einen kleinen Teil unserer Reise einlassen.
00:03:12.020 --> 00:03:22.200
Mark Johnson: Wenn wir über die Zeit nachdenken, die wir heute haben, werden wir uns stark auf Bildung konzentrieren, aber auch diese Bildung nutzen und in die Tat umsetzen.
00:03:22.410 --> 00:03:36.660
Mark Johnson: Sie werden sehen, was auf dem Markt passiert, wenn es um KI im Finanzwesen geht. Wir werden einige Statistiken veröffentlichen und darüber sprechen, wohin sich Unternehmen bewegen und warum diese Transformation nicht warten kann.
00:03:37.170 --> 00:03:57.870
Mark Johnson: Wir werden über G. Smart sprechen. G. Smart ist unsere KI-Philosophie, nach der wir wirklich darüber nachdenken, Sie und Ihre Teams zu verstärken, anstatt etwas sehr Taktisches zu erweitern oder wegzunehmen. Es geht um viel mehr als das, wenn es um die Strategie geht, die wir hoffentlich Ihren Teams zur Verfügung stellen können.
00:03:58.350 --> 00:04:14.209
Mark Johnson: Wir werden gleich darauf eingehen, wohin wir aus Sicht der Produktinnovation gehen, während wir darüber nachdenken, die Treasury-Workflows so zu gestalten, wie es Evan gesagt hat. Wir werden das Ganze in Form einer echten Live-Produktionsdemo präsentieren
00:04:14.340 --> 00:04:20.519
Mark Johnson: Und dann gebe ich dir sozusagen einen Blick hinter die Kulissen. Schauen Sie sich an, worauf wir uns in letzter Zeit konzentriert haben.
00:04:21.130 --> 00:04:22.230
Mark Johnson: Q. Und ein.
00:04:22.400 --> 00:04:35.679
Mark Johnson: Wie wir oben erwähnt haben, sehr wichtig für uns. Also springen Sie bitte ein und nutzen Sie die Q & A-Funktion an jeder Stelle, wenn Fragen auftauchen. Wenn wir heute nicht alle Fragen beantworten können, werden wir individuell darauf eingehen
00:04:36.508 --> 00:04:53.720
Mark Johnson: Bitte stellen Sie sicher, dass Sie diese Funktion verwenden. Das Letzte, womit ich beginnen werde, ist, dass wir heute mit einem Ziel gestaltet werden wollen: Ihnen zu helfen, Zeit zu gewinnen, um das zu tun, was Sie am besten können, strategisch zu denken, Beziehungen aufzubauen und letztendlich Ihr Unternehmen voranzubringen.
00:04:55.780 --> 00:05:16.360
Mark Johnson: Der richtige Zeitpunkt für das Finanzwesen in Bezug auf KI ist jetzt gekommen, da wir über den immensen Wandel nachdenken, der gerade stattfindet. Es handelt sich nicht um einen allmählichen Wandel, sondern um einen wahrhaft seismischen Wandel und insbesondere die Leistungsfähigkeit generativer KI für viele verschiedene Funktionen.
00:05:16.680 --> 00:05:28.719
Mark Johnson: Dies sind einige Statistiken, die wir verfolgt haben. Diese Statistiken tauchen ständig in neuen Quellen auf. Ich möchte mit ein paar beginnen, denen wir sehr nahe gekommen sind
00:05:29.320 --> 00:05:37.590
Mark Johnson: Die ersten 79% der CFOs planen, die KI-Budgets im Jahr 2025 zu erhöhen.
00:05:38.010 --> 00:05:51.469
Mark Johnson: Der aufschlussreichste und aufschlussreichste Teil dieser Statistik ist die Tatsache, dass dies nicht unbedingt die Early Adopters oder die Tech-Enthusiasten sind. Dies sind pragmatische Führungskräfte im Finanzbereich
00:05:51.840 --> 00:05:53.319
Mark Johnson: Wer hat die Zahlen berechnet
00:05:53.610 --> 00:06:13.949
Mark Johnson: Sie investieren nicht, weil KI im Trend liegt. Sie investieren nicht, weil alle über KI sprechen. Sie investieren, weil sie den wahren Nutzen sehen, und sie führen auch dieses Gespräch mit ihren Kollegen und hören die Gelegenheit, ihren Teams Tag für Tag die Arbeit abzunehmen.
00:06:14.050 --> 00:06:25.829
Mark Johnson: Wenn Sie sehen, dass sich 7, 8 von 10 CFOs in dieselbe Richtung bewegen, können Sie nicht mehr davon ausgehen, dass es sich um einen Trend handelt. Das ist quasi die neue Art zu sein, die neue Art zu arbeiten
00:06:26.580 --> 00:06:28.240
Mark Johnson: Der nächste große Schritt.
00:06:28.660 --> 00:06:35.940
Mark Johnson: 94% der CFOs erwarten, dass generative KI ihre Funktion stark verbessern wird.
00:06:36.340 --> 00:06:42.820
Mark Johnson: In meinen Jahren der Technologiebranche ist es sehr selten, eine so überwältigende Statistik zu sehen.
00:06:43.050 --> 00:06:52.759
Mark Johnson: vor allem eine Vereinbarung über eine strategische Initiative. Wir haben alle an diesen Diskussionen, diesen Sitzungssälen, diesen Vorstandssitzungen teilgenommen. Wenn Sie einen so großen Konsens haben.
00:06:52.890 --> 00:06:55.509
Mark Johnson: Sie wissen, dass die Beweise zu diesem Zeitpunkt unbestreitbar sind.
00:06:56.180 --> 00:07:06.460
Mark Johnson: Wenn wir über die Ergebnisse nachdenken. Nehmen wir einfach Prognosen als einfaches Beispiel, die Möglichkeit, die Genauigkeit um 30% oder mehr zu erhöhen. Das ist ein entscheidender Faktor.
00:07:07.230 --> 00:07:08.849
Mark Johnson: Der 3. große Staat.
00:07:09.340 --> 00:07:23.529
Mark Johnson: 58% der Finanzfunktionen wurden bereits übernommen. KI im Jahr 2024. Nun, das heißt nicht unbedingt, dass das alles generativ ist. KI Traditionelle KI gibt es schon etwas länger, wenn wir an maschinelles Lernen denken.
00:07:23.660 --> 00:07:31.459
Mark Johnson: Aber worüber Sie nachdenken sollten, ist die Tatsache, dass dieser Wert gegenüber den 37% im Vorjahr gestiegen ist.
00:07:31.670 --> 00:07:38.710
Mark Johnson: Das ist ein großer Wandel, und das spricht auch dafür, dass KI und ihre Fähigkeiten immer umfangreicher werden.
00:07:39.480 --> 00:07:43.240
Mark Johnson: Das andere Stück, das andere Schlüsselstück, ist, schauen Sie auf die rechte Seite
00:07:43.590 --> 00:07:46.560
Mark Johnson: wenn wir darüber nachdenken, wo
00:07:46.850 --> 00:07:59.060
Mark Johnson: Es wird wirklich interessant. CFOs wollen KI, auf die sie sich verlassen können. Sie wollen keine Blackboxen. Sie wollen Transparenz. Sie wollen eine Erklärung.
00:07:59.340 --> 00:08:04.539
Mark Johnson: Wir wissen, dass Vertrauen verdient wird. Hier lebt G. Treasury täglich nach diesem Motto.
00:08:05.050 --> 00:08:16.380
Mark Johnson: Dies steht auch im Einklang mit einigen aktuellen Untersuchungen von McKinsey, die ihren eigenen Bericht zum Stand der KI veröffentlicht haben. Und das Faszinierende an diesem Bericht ist die Tatsache
00:08:16.670 --> 00:08:31.339
Mark Johnson: Wir sind jetzt an einem Punkt angelangt, an dem 21% der Unternehmen angaben, generative KI und einen völlig neu konzipierten Arbeitsablauf zu verwenden, eine völlig neu konzipierte Art und Weise, wie Arbeit in einer bestimmten Funktion erledigt wird.
00:08:31.810 --> 00:08:36.569
Mark Johnson: Das andere Stück, das wirklich interessant war, als wir diese Studie durchführten, ist die Tatsache, dass
00:08:37.159 --> 00:08:54.219
Mark Johnson: Wenn Sie an die KI-Transformation denken, handelt es sich im Grunde um eine organisatorische Transformation. Diese Organisation überdenkt die Art und Weise, wie Arbeit erledigt wird, aber auch die Tools, die genutzt werden, um diese Arbeit zu erledigen und die zu erledigende Aufgabe zu erledigen.
00:08:55.110 --> 00:09:06.709
Mark Johnson: Insbesondere der CEO ist derjenige, der häufig an der Überwachung dieser KI-Governance beteiligt ist, eine große Veränderung gegenüber allem, was wir je zuvor in der Technologiewelt gesehen haben.
00:09:10.020 --> 00:09:10.970
Mark Johnson: Also
00:09:11.140 --> 00:09:21.190
Mark Johnson: Worauf wir noch eingehen wollten, bevor wir zu tief gehen, ist eine kurze Umfragefrage darüber, wo ihr euch auf eurer Reise befindet.
00:09:21.560 --> 00:09:24.110
Mark Johnson: Die Frage ist also.
00:09:24.280 --> 00:09:34.230
Mark Johnson: Wann rechnen Sie mit der Implementierung von KI im Finanzbereich? Wir geben allen ein paar Sekunden, um darauf zu antworten, und schauen uns dann die Ergebnisse an.
00:10:24.370 --> 00:10:36.590
Mark Johnson: Okay, es sieht so aus, als ob wir 35% haben, die beabsichtigen, KI im Jahr 2026 zu implementieren, wir haben
00:10:36.770 --> 00:10:49.559
Mark Johnson: Weitere 11%, die heute schon KI verwenden, und dann 16%. Diese planen, KI noch vor Jahresende in ihren Betrieb einzuführen. Also nochmal.
00:10:50.090 --> 00:10:59.850
Mark Johnson: Ziemlich relevant und bezieht sich auf die frühere Folie, die etwa 50 bis 60% bereits eingeführt haben oder planen, dies in naher Zukunft zu tun.
00:11:04.320 --> 00:11:17.789
Mark Johnson: Nun, einige von Ihnen haben vielleicht gesehen, dass unsere Einführung von G. Smart und G. Smart für uns beide ein Meilenstein ist, und es ist ein Ausgangspunkt auf dieser Reise, an der wir jetzt teilnehmen.
00:11:18.030 --> 00:11:28.179
Mark Johnson: Wir haben G. Smart als eine Art Zukunft des KI-gestützten Finanzministeriums vorgestellt. Gleichzeitig ändern wir unser Leitbild als Unternehmen nicht.
00:11:28.300 --> 00:11:35.819
Mark Johnson: Seit Jahren konzentriert sie sich im Finanzministerium auf die Klarheit, um zu handeln und zu versuchen, Werte zu steigern
00:11:36.220 --> 00:11:37.909
Mark Johnson: Für unsere Kunden.
00:11:38.200 --> 00:11:42.229
Mark Johnson: Was sich geändert hat, ist das Ausmaß dessen, was möglich ist.
00:11:42.790 --> 00:11:48.860
Mark Johnson: G. Smart vertritt die Überzeugung, dass das zukünftige Amt des CFO.
00:11:49.050 --> 00:11:53.570
Mark Johnson: Wird nicht nur durch die Aufgaben definiert, die erledigt werden, sondern
00:11:54.070 --> 00:12:03.720
Mark Johnson: Die Erkenntnisse, die an die Öffentlichkeit gelangen können, die Erkenntnisse, die sich etwas später am heutigen Tag zeigen werden, aber auch die Entscheidungen, die Sie beschleunigen können
00:12:03.940 --> 00:12:10.999
Mark Johnson: Und die Strategien, die Sie dann auf der Grundlage dieser Entscheidung aktivieren können. Herstellungsprozess
00:12:11.160 --> 00:12:17.809
Mark Johnson: Das passiert, wenn Ihre Mitarbeiter von einem Teil der betrieblichen Schwierigkeiten befreit werden, denen sie heute gegenüberstehen.
00:12:21.680 --> 00:12:31.099
Mark Johnson: KI ist für G. Treasury nichts Neues. Wie ich bereits erwähnt habe, gibt es traditionelle KI schon seit einigen Jahren, und
00:12:31.821 --> 00:12:39.810
Mark Johnson: Diese Tabelle zeigt einige Dinge, bei denen ich die allererste Transparenz zum Ausdruck bringen wollte.
00:12:40.170 --> 00:12:50.610
Mark Johnson: Während wir über verschiedene Lösungen innerhalb von G Treasury nachdenken. Wir möchten Ihnen genau sagen, welche Funktion die KI erfüllt.
00:12:51.190 --> 00:12:56.259
Mark Johnson: Welche Art von Modell verwenden wir spezifisch für KI,
00:12:56.380 --> 00:13:00.520
Mark Johnson: Und dann auch, welche Vorteile bringt es Ihnen?
00:13:00.780 --> 00:13:06.830
Mark Johnson: wenn wir am Beispiel von Liquiditätsprognosen unter Verwendung agentischer KI sprechen
00:13:07.260 --> 00:13:12.489
Mark Johnson: zur Entscheidungsfindung. Wir möchten, dass Sie wissen, was das bedeutet. Und wie funktioniert das?
00:13:13.020 --> 00:13:15.160
Mark Johnson: Das zweite große Ding ist
00:13:15.330 --> 00:13:24.290
Mark Johnson: Unser Ansatz und wie vielfältig er ist, wenn es darum geht, nicht jedem Problem ein KI-Modell aufzuzwingen.
00:13:24.770 --> 00:13:36.310
Mark Johnson: Wir wissen, dass sich statistische Modelle hervorragend für Vorhersagen eignen. Wir wissen, dass sich Fuzzy-Logik hervorragend für den Mustervergleich eignen kann.
00:13:36.870 --> 00:13:44.690
Mark Johnson: Wir wissen auch, dass sich agentische KI hervorragend für intelligente Entscheidungen, Unterstützung und Aktionen eignet.
00:13:44,810 --> 00:14:03.000
Mark Johnson: Also, wenn wir über die Lösungen innerhalb von G Treasury nachdenken. Wir sind sehr gewissenhaft bei der Anwendung des KI-Modells, das am besten geeignet ist, um eine Art von Aufgabe zu erledigen, die sich auflöst, die uns die Mühe nimmt und die Aufgabe in Ihrem Namen erledigt.
00:14:03.950 --> 00:14:08.810
Mark Johnson: Das Letzte, worauf wir uns ständig konzentrieren, ist
00:14:08.960 --> 00:14:22.719
Mark Johnson: Die Ergebnisse, wir investieren offensichtlich Zeit, um diese Lösung zu entwickeln. Und wir wollen sicherstellen, dass wir diese Zeit effektiv investieren. Und während wir über die möglichen Vorteile nachdenken.
00:14:22.780 --> 00:14:45.009
Mark Johnson: Diese sind nicht mehr nur theoretisch. Nun, das sind Vorteile. Wir sehen aus erster Hand, wenn es um die Genauigkeit von Prognosen geht, und verbessern uns, wenn es darum geht, Risikoszenarien in Minuten und nicht in Stunden zu simulieren. Wenn es um Integrationen geht, die sie früher in Anspruch genommen haben. Wochen können jetzt in Stunden erledigt werden.
00:14:45.160 --> 00:14:49.190
Mark Johnson: All dies ist ein echter, greifbarer Vorteil, der den Wert steigert.
00:14:49.470 --> 00:14:57.270
Mark Johnson: Diese Grundlage ist auch wichtig, weil sie der Höhepunkt von allem ist, was wir im Laufe der Zeit gelernt haben
00:14:57.540 --> 00:15:05.509
Mark Johnson: Und wie wir Intelligenz in die Treasury-Workflows eingebettet haben und gleichzeitig sehr darauf ausgerichtet sind.
00:15:05.610 --> 00:15:07.910
Mark Johnson: Was braucht dein Team eigentlich?
00:15:11.620 --> 00:15:13.199
Mark Johnson: Wahrscheinlich der Elefant im Zimmer
00:15:13.610 --> 00:15:28.680
Mark Johnson: Daten. Und offensichtlich liegt uns das sehr am Herzen. Es liegt dir sehr am Herzen. Aber der Schutz dieser Daten ist in erster Linie das wichtigste Prinzip, das wir haben, wenn wir über G. Smart nachdenken.
00:15:29.100 --> 00:15:32.360
Mark Johnson: Wir haben mit Hey, dein Vertrauen verdient
00:15:32.510 --> 00:15:39.040
Mark Johnson: erfordert mehr als nur Versprechen. Es erfordert einen soliden Architekturansatz.
00:15:39.250 --> 00:15:47.569
Mark Johnson: Es erfordert Governance, es erfordert Transparenz und was auf der gesamten Plattform passiert.
00:15:47.730 --> 00:15:51.980
Mark Johnson: Und wenn wir darüber nachdenken, mit der Datenseite zu beginnen.
00:15:52.090 --> 00:16:17.150
Mark Johnson: Wir wollen sicherstellen, dass, hey, Sie darauf vertrauen, wie wir die Lösung geschaffen haben. Alles beginnt mit Ihren Daten. Leben Sie in Ihrer eigenen Umgebung. Es gibt keine gemeinsame Verarbeitung. Es findet kein Austausch von Daten zwischen Mietern statt. Es gibt keinen mysteriösen Datensee, in dem Informationen vermischt werden könnten. Stellen Sie sich das so vor, als hätten Sie Ihre eigene private KI, auf der trainiert wurde
00:16:17.450 --> 00:16:21.390
Mark Johnson: Das Wissen der Welt, kann dann aber nur Ihre Daten sehen.
00:16:21.960 --> 00:16:32.249
Mark Johnson: Das zweite große Prinzip, dem wir gefolgt sind, ist die Tatsache, dass dies nur Inferenz ist. AI. Was heißt das? Es bedeutet, dass Ihre Daten
00:16:32.410 --> 00:16:34.719
Mark Johnson: wird nie zum Trainieren von Modellen verwendet.
00:16:35.350 --> 00:16:41.420
Mark Johnson: Wir stellen sicher, dass die KI ihre Intelligenz auf Ihre Daten anwendet, ohne daraus zu lernen.
00:16:42.510 --> 00:16:47.239
Mark Johnson: Ein weiterer wichtiger Aspekt ist die geografische Kontrolle.
00:16:47.510 --> 00:16:52.089
Mark Johnson: Wir betreuen Kunden auf der ganzen Welt. Wir wollen deine Daten
00:16:52.260 --> 00:16:57.590
Mark Johnson: in Ruhe, um in der von Ihnen ausgewählten geografischen Region in Ruhe zu bleiben.
00:16:57.760 --> 00:17:02.910
Mark Johnson: Ob das in den USA ist. Ob das in EMEA ist. Ob das in APAC ist
00:17:03.110 --> 00:17:09.520
Mark Johnson: Das geht darauf zurück, wie wir es von Anfang an eingerichtet haben, endlich Kontrolle
00:17:10.351 --> 00:17:38.769
Mark Johnson: visibility into what is taking place in the platform is is key as well as the outputs that are being delivered. So being able to showcase the dotted trails around those outputs to showcase why a a particular step was taken. And then the user involvement around working with that particular let's call it agent. Experience like that could exist within the platform
00:17:39.800 --> 00:17:47.799
Mark Johnson: much more we go into here, but definitely wanted to focus on hey? Top of mind for us always as we're building
00:17:49.720 --> 00:18:00.650
Mark Johnson: the other piece that we wanted to walk through and kind of sneak peek behind the hood is our own internal transformation at G. Treasury.
00:18:01.350 --> 00:18:19.169
Mark Johnson: You've probably heard me mention transformation. You've heard me mention journey, and that's because it it really is. We're all keeping abreast with what's going on in the market. What are new sources we want to tap into to learn. How do we continue to set up our teams for success? And as we think about
00:18:19.420 --> 00:18:25.750
Mark Johnson: this particular slide, these aren't just principles, but they're how we operate day to day
00:18:25.960 --> 00:18:31.069
Mark Johnson: and to kind of give you some some real tangible examples here.
00:18:31.260 --> 00:18:46.710
Mark Johnson: Our product team, Evan, myself, the rest of the team. We're using AI across different parts of our day to day workflow when it comes to how we think about writing product requirements for something new that we plan to develop
00:18:47.000 --> 00:19:07.470
Mark Johnson: how we are able to prototype designs again in minutes which would have taken weeks before. That allows us to get real time feedback from those of you who are on the call from our clients, our our prospects, our partners, that feedback allows us to move a lot faster, and then
00:19:07.780 --> 00:19:12.390
Mark Johnson: we can frankly use that time back to spend more time.
00:19:12.570 --> 00:19:21.820
Mark Johnson: better understanding where you have new problems that are there popping up. It's that shift from doing manual work to more strategic work.
00:19:22.560 --> 00:19:30.000
Mark Johnson: The other piece that has been a big amplifier for us is this, this culture of experimentation.
00:19:30.210 --> 00:19:50.189
Mark Johnson: and where we see a lot of value and benefit is the ability to run workshops, the ability to run hackathons, to have a thesis in mind so that we're not chasing every shiny object. You will hear a lot of companies building AI just to build AI.
00:19:50.620 --> 00:19:59.339
Mark Johnson: We don't want to be that company. We want to make sure that we are scaling something that actually works and actually solves a problem
00:20:00.250 --> 00:20:03.229
Mark Johnson: outcome which leads us to outcome driven innovation.
00:20:03.840 --> 00:20:22.950
Mark Johnson: We've developed our own framework on how we think about prioritizing use cases. And to give you an example there for us, is it a high frequency task that's being done by a number of of companies? Is it a high, painful task? And then
00:20:23.070 --> 00:20:35.210
Mark Johnson: can AI actually amplify that that experience, that process? So someone spending a day a week on forecast analysis could hit all 3 check check boxes.
00:20:36.200 --> 00:20:47.570
Mark Johnson: the last and definitely most important. Hey, we want to bring our customers along as a part of any of this experience, and we want to start with conversations. We want to start with
00:20:47.710 --> 00:20:51.679
Mark Johnson: an early access program. That is, that isn't just beta testing.
00:20:51.790 --> 00:21:04.560
Mark Johnson: But it's frankly co-creating the experience together. When a customer tells us, Hey, I need a board level view of these insights. They're not just giving feedback. They're helping us co-design as we go.
00:21:04.840 --> 00:21:05.680
Mark Johnson: So
00:21:05.870 --> 00:21:13.729
Mark Johnson: take these principles, adapt them, modify them as as best fit for for you and your company. And then.
00:21:14.311 --> 00:21:22.619
Mark Johnson: understand, it isn't all technology. It's also about, hey? Starting with conviction, starting with your team and and your culture as a company.
00:21:25.930 --> 00:21:33.159
Mark Johnson: So now we're gonna switch gears a little bit and we're gonna showcase what we've been working on.
00:21:33.500 --> 00:21:51.989
Mark Johnson: some of which is live, some of which is in flight and definitely has an opportunity to get early access candidates, giving us feedback along the way. And some of it's in that design stage, but wanted to showcase a few examples to make it real for for you guys
00:21:53.070 --> 00:22:02.229
Mark Johnson: to to level set here, as we think about G. Smart, there's 2 key components to keep in mind
00:22:03.040 --> 00:22:04.100
Mark Johnson: one.
00:22:04.300 --> 00:22:13.169
Mark Johnson: It is how we're thinking about agents, agents that are designed to complete a specific Treasury task
00:22:13.320 --> 00:22:24.959
Mark Johnson: agents that can reason through problems. They can discover patterns, and they can recommend an action all while keeping the team in the loop
00:22:25.320 --> 00:22:27.039
Mark Johnson: throughout that process.
00:22:27.540 --> 00:22:29.810
Mark Johnson: The second piece is.
00:22:30.090 --> 00:22:50.090
Mark Johnson: think of it as your control tower, your hub where it's not just a dashboard of what's taking place, but a single area of the platform where you can govern, you can create, you can set your own unique thresholds to any one experience.
00:22:50.520 --> 00:23:00.329
Mark Johnson: We obviously know that not all clients are treated equally. Everyone has their own policies, their own processes. This is where the hub starts to come into play
00:23:00.680 --> 00:23:13.069
Mark Johnson: without the Hub. Agents are just isolated tools, and could be powerful, but could be very disconnected from your processes. So you don't want that. At the same time.
00:23:13.200 --> 00:23:14.759
Mark Johnson: if you think about
00:23:14.870 --> 00:23:32.569
Mark Johnson: Wenn Sie nur einen Hub haben, möchten Sie nicht nur das Dashboard und keine Möglichkeit haben, Ihre eigenen Workflows zu orchestrieren. Die beiden Elemente kommen also zusammen, wenn wir über unsere Vision von G. Smart AI nachdenken, und werden dann zu einem wichtigen Bestandteil jeder Treasury-Transformation.
00:23:35.710 --> 00:23:45.559
Mark Johnson: G. Intelligente Prognoseeinblicke. Ich werde hier bewusst nicht zu viel von Evans Donner stehlen, da wir uns in einer Demo eingehend damit befassen werden. Aber
00:23:45.820 --> 00:23:59.860
Mark Johnson: Ich wollte ein bisschen zur Schau stellen, indem ich eine Geschichte darüber erzähle, wie das für uns angefangen hat. Also fiktiver Name. Wir verwenden Sarah als Leiterin des Finanzministeriums, die wahrscheinlich viele von Ihnen bei der Telefonkonferenz vertritt.
00:24:0.680 --> 00:24:04.110
Mark Johnson: Jeden, sagen wir, Donnerstag jeder Woche
00:24:04.270 --> 00:24:21.420
Mark Johnson: Sie durchläuft eine Routine. Sie erstellt ihren eigenen Prognosevergleichsbericht. Wahrscheinlich muss sie das nach Excel exportieren, um ihre eigenen Analysen durchführen zu können. Normalerweise geht sie Zeile für Zeile vor, um herauszufinden, was die größte Varianz ist?
00:24:21.770 --> 00:24:26.139
Mark Johnson: Worüber sollte ich besorgt sein? Was ist ungeklärt und was erklärt?
00:24:26.310 --> 00:24:37.650
Mark Johnson: Und dann muss sie das alles in eine Art Zusammenfassung fassen, die eine Zusammenfassung für ihr Führungsteam sein könnte, die für einen Manager sein könnte. Es könnte in einer Vorstandspräsentation verwendet werden.
00:24:38.340 --> 00:24:48.230
Mark Johnson: Abgesehen davon ist das ein manueller Prozess, der jede Woche für Sarah und dann für die Empfänger dieser Informationen mehrere Stunden in Anspruch nimmt.
00:24:49.680 --> 00:24:56.319
Mark Johnson: Wenn Sie an die Prognoseseiten von G. Smart denken, lautet unser Ziel: Wie reduzieren wir
00:24:56.480 --> 00:25:00.099
Mark Johnson: Aus dem Marathon ein 15-minütiger Sprint?
00:25:00.280 --> 00:25:03.620
Mark Johnson: Und das wird Evan gleich vorstellen.
00:25:05.460 --> 00:25:16.530
Mark Johnson: Der zweite Punkt, den wir hervorheben wollten, ist ein ähnlicher Ansatz wie unsere Risikomanagementlösung. Aber
00:25:16.970 --> 00:25:21.140
Mark Johnson: Ein anderer Anwendungsfall, wenn wir über Risiken nachdenken
00:25:21.750 --> 00:25:34.460
Mark Johnson: Risiko. Bei Richtlinien handelt es sich insbesondere um sehr lange Dokumente, die wahrscheinlich in mehreren Formaten vorliegen und sehr guten Inhalt haben, aber in einer statischen Form gefangen sind.
00:25:35.200 --> 00:25:40.940
Mark Johnson: Möglicherweise haben Sie Risiken, die nachverfolgt werden, und Excel-Tabellen.
00:25:41.200 --> 00:25:50.269
Mark Johnson: Möglicherweise haben Sie Ihre Richtlinie so eingerichtet, dass sie feststellt, wenn Sie einen Verstoß haben, aber vielleicht erfahren Sie erst Monate später von diesem Verstoß.
00:25:51.580 --> 00:25:55.650
Mark Johnson: Im Allgemeinen kommen Sie in einem Prozess viel zu spät. Also
00:25:56.070 --> 00:25:59.330
Mark Johnson: Während wir darüber nachdenken, KI hier anzuwenden.
00:25:59.750 --> 00:26:02.950
Mark Johnson: G. Intelligente Risiken, Erkenntnisse können zurückgehen
00:26:03.300 --> 00:26:24.769
Mark Johnson: Das spart Ihnen Zeit und hilft Ihnen bei der Entscheidungsfindung. Wir können den Einsatz von KI zum Lesen von Risikorichtlinien in Betracht ziehen, um Ihre Risiken kontinuierlich zu überwachen und Sie zu warnen, bevor es zu Verstößen kommt, und das alles in Echtzeit innerhalb der Plattform. Nicht nachdem dies passiert ist, sondern bevor es passiert.
00:26:24.970 --> 00:26:32.279
Mark Johnson: Und noch einmal, das ist einer der Bereiche, an denen wir jetzt anfangen zu arbeiten, und natürlich würden wir uns über Feedback freuen
00:26:32.540 --> 00:26:36.780
Mark Johnson: von denen, die am Anruf beteiligt waren. Während wir uns auf diese Reise begeben. Als Nächstes.
00:26:37.240 --> 00:26:43.990
Mark Johnson: Das dritte Stück, das wir präsentieren wollten, heißt unser G Smart Hub.
00:26:44.750 --> 00:26:57.190
Mark Johnson: Und, wie ich bereits erwähnt habe, stellen Sie sich das als eine Art Kontrollturm vor, Ihre Kommandozentrale, in der Sie sehen können, welche Agenten verfügbar sind.
00:26:57.590 --> 00:27:12.189
Mark Johnson: Sie können damit beginnen, herauszufinden, welche für Ihr Unternehmen sinnvoll sind, und dann können Sie den nächsten Schritt unternehmen, nämlich wie möchte ich sie für mein Unternehmen konfigurieren? Also, um Ihnen ein Beispiel aus der Praxis zu geben. Denk darüber nach
00:27:12.440 --> 00:27:15.760
Mark Johnson: Der Prozess zur Einreichung von Liquiditätsprognosen.
00:27:15.890 --> 00:27:23.340
Mark Johnson: Sie haben mehrere Geschäftsbereiche auf der ganzen Welt. An der Einreichung von Prognosen sind mehrere Personen beteiligt
00:27:23.490 --> 00:27:36.690
Mark Johnson: auf Hochfrequenzbasis. Was ist, wenn Sie die Person sind, die sie alle verfolgt? Nun, das macht keinen Spaß, E-Mails zu versenden. Sie erhalten Telefonanrufe, in denen versucht wird, alle dazu zu bringen, den Prozess zu durchlaufen. Du hast gesagt.
00:27:37.320 --> 00:27:48.109
Mark Johnson: Was wäre, wenn Sie einen Agenten haben könnten, der diese Maßnahmen in Ihrem Namen ergreift? Was wäre, wenn Sie es so konfigurieren könnten, dass es heißt: Hey, schau! Die Einreichung der Prognosen wird fällig
00:27:48.250 --> 00:27:51.100
Mark Johnson: jeden Freitag zu diesem Zeitpunkt jeder Woche.
00:27:51.320 --> 00:27:58.429
Mark Johnson: Und ich werde eine echte Zeit haben. Überblick darüber, wer bis Mitte der Woche eingereicht hat und wer nicht.
00:27:58.590 --> 00:28:00.250
Mark Johnson: und wenn Sie nicht eingereicht haben.
00:28:00.590 --> 00:28:14.970
Mark Johnson: Lassen Sie den Agenten Sie verfolgen und Sie daran erinnern, dass wir die vom Staat eingereichte Prognose benötigen, und dann können Sie kontinuierlich eine Momentaufnahme der Entwicklung, der abgeschlossenen Prognosen erhalten und so fahren
00:28:15.250 --> 00:28:42.540
Mark Johnson: a much more proactive behavior and giving you time back in your day to day. That's just one example of where you can start to control that experience to your own internal process. And then the second piece of it is okay. I can start to view other usage statistics across other agents. I can start to see the Roi firsthand
00:28:42.630 --> 00:28:49.879
Mark Johnson: of time savings that may be realized. Efficiency gains forecast accuracy, gains
00:28:50.210 --> 00:29:05.420
Mark Johnson: all of that in one place, and you can then follow what you want to do next. And maybe if I'm having success with this agent, I can go and think about this, this next use case and start to measure the Roi there
00:29:06.230 --> 00:29:17.139
Mark Johnson: again. This is this is where we're going, and and more to come on this one, and always for feedback as we as we co-design this with with an existing group of clients.
00:29:19.110 --> 00:29:28.719
Mark Johnson: So we're gonna switch gears again. And we're gonna open up another poll question. And as a part of this poll question
00:29:29.130 --> 00:29:32.960
Mark Johnson: I'll I'll have Evan. Then jump into the demo
00:29:33.931 --> 00:29:37.550
Mark Johnson: after the demo. We will leave some time for Q&A at the end.
00:29:45.230 --> 00:29:53.710
Mark Johnson: The question is, in which areas would your organization like to raise the bar for forecasting? And you can check multiple answers.
00:31:00.480 --> 00:31:04.439
Evan Ryan: I think we might give it one more, one or 2 more seconds on the
00:31:04.610 --> 00:31:09.270
Evan Ryan: those answers should be popping up perfect.
00:31:10.210 --> 00:31:13.250
Evan Ryan: Okay, so in which areas
00:31:14.316 --> 00:31:17.679
Evan Ryan: would your organization like to raise the bar for forecasting
00:31:18.739 --> 00:31:28.300
Evan Ryan: more advanced methods can see coming in at 24% better explanations required, and
00:31:28.500 --> 00:31:31.899
Evan Ryan: you can see less tolerance for errors at 11%.
00:31:33.120 --> 00:31:39.439
Evan Ryan: But just to call out the the better explanations required coming in at 27%. The highest
00:31:40.146 --> 00:31:42.280
Evan Ryan: are the more advanced methods
00:31:42.410 --> 00:31:58.379
Evan Ryan: at 24%. You know, that really does feed into the demo that I'll actually be jumping into now really focusing on the you know better explanations required so highlighting those key insights in a
00:31:59.210 --> 00:32:00.860
Evan Ryan: AI agentic manner
00:32:01.020 --> 00:32:16.189
Evan Ryan: and more advanced methods, there's some really cool data visualizations that I'm really excited to to show you today. So with that, I'll start sharing my screen here, Mark and I'll jump into the demo
00:32:22.690 --> 00:32:23.710
Evan Ryan: perfect.
00:32:24.746 --> 00:32:30.449
Evan Ryan: So here within GtTreasury, forecasting within our reporting suite.
00:32:31.327 --> 00:32:38.569
Evan Ryan: So, as Mark mentioned, you know, we're deploying AI across the G Treasury platform
00:32:39.353 --> 00:32:46.819
Evan Ryan: initially within G. Treasury forecasting and specifically within the G Treasury forecasting suite itself.
00:32:47.240 --> 00:32:52.459
Evan Ryan: So what we're looking at here is the landing page for the comparison report
00:32:53.190 --> 00:33:02.239
Evan Ryan: the comparison report compares 2 separate versions or snapshots of your forecast.
00:33:02.490 --> 00:33:10.630
Evan Ryan: In this instance I have my latest submission. So again, as Mark was talking about the G smart Hub.
00:33:11.334 --> 00:33:21.839
Evan Ryan: and that Treasury analyst preparing their submissions. Let's say that submission is prepared and finalized on that Thursday, and then that user then wants to compare
00:33:22.000 --> 00:33:31.179
Evan Ryan: the version that they've just prepared. Compare that, then, to their previous version, and then to dig into the variances in that report.
00:33:31.340 --> 00:33:33.910
Evan Ryan: So actually just run the report here.
00:33:35.800 --> 00:33:41.400
Evan Ryan: I have my report here with my forecast versus actuals and my forecast versus forecast.
00:33:41.680 --> 00:33:45.019
Evan Ryan: and I've grouped it by business unit.
00:33:45.490 --> 00:34:03.829
Evan Ryan: One thing I want to call out is that initial new feature that we have here? So you can see a spotlight panel that I can expand upon, and that's straight away, highlighting key variances that are surfaced within that report. So you know.
00:34:04.070 --> 00:34:12.650
Evan Ryan: we're talking about really reducing that toil and straight away you can see that this is really delivering value.
00:34:12.800 --> 00:34:16.739
Evan Ryan: So in this case there are 4 hidden cash flow differences that are uncovered.
00:34:17.179 --> 00:34:21.800
Evan Ryan: Firstly, we have a closing balance variance of a little over
00:34:22.110 --> 00:34:30.370
Evan Ryan: half 1 million dollars, calling out that balance between that forecast versus actuals piece than the largest negative variance.
00:34:30.510 --> 00:34:33.860
Evan Ryan: the largest positive variance, and then
00:34:34.020 --> 00:34:56.489
Evan Ryan: 2 new metrics that we're introducing as well. So smape and wmape really focusing on the accuracy of your forecast. So wmape is the weighted version really focusing on looking at the big ticket items and smape, looking at each line item in this case at an individual weighted level.
00:34:56.820 --> 00:35:16.689
Evan Ryan: and to interpret this. So the lower both of these figures are the better. But just to interpret what I'm looking at here, it looks like, because this W. Map is lower. I'm better at forecasting the bigger ticket items, and than I am at forecasting the smaller ticket items.
00:35:17.390 --> 00:35:38.680
Evan Ryan: I can click on this. I can see a bit more of an explainer here. And also we've embedded a helpful guide that goes into a bit more from a mathematical standpoint with the different formulas that we're using and how to actually interpret it, the pros and cons of the 2 different metrics.
00:35:38.920 --> 00:35:45.009
Evan Ryan: and, as I said, how to interpret your metrics, and then tips on how to improve your forecast
00:35:45.200 --> 00:35:46.439
Evan Ryan: going forward.
00:35:46.990 --> 00:35:50.350
Evan Ryan: So with that I'll generate the insights.
00:35:50.540 --> 00:35:53.590
Evan Ryan: And so, as I said, you know.
00:35:53.790 --> 00:35:59.869
Evan Ryan: straight away, I'm seeing great value from G smart, but I can, you know.
00:36:00.400 --> 00:36:05.645
Evan Ryan: do a deeper dive of my variance report here, and
00:36:06.910 --> 00:36:14.979
Evan Ryan: I can see from my tooltip here. So it's doing a number of things and evaluating the variance
00:36:15.560 --> 00:36:29.589
Evan Ryan: materiality thresholds. So it's preparing that forecast assessment, that executive summary that Mark was talking about a couple of moments ago, and then really will lead into the different sections of the report.
00:36:30.180 --> 00:36:33.060
Evan Ryan: And then, you know, based off of that
00:36:33.520 --> 00:36:47.470
Evan Ryan: question that was posed to you a couple of months ago. The on that poll question, a couple of cool visualizations that I I want to show you today.
00:36:48.410 --> 00:36:52.889
Evan Ryan: So and it's not just in the comparison report. This
00:36:53.060 --> 00:36:59.099
Evan Ryan: insights is actually also available in the Consolidation Report, which I'll show you in a couple of moments.
00:37:00.580 --> 00:37:09.970
Evan Ryan: So straight off the bat I can see what 2 submissions are being compared, and then the deep dive
00:37:10.556 --> 00:37:24.639
Evan Ryan: in the actual analysis. So I can look here at servicing the executive summary. So a high, level overview of the actual report that I sent to the AI model to be analyzed.
00:37:24.880 --> 00:37:32.540
Evan Ryan: I'm calling out the opening balance, the receipts, and then there are a number of key areas that I want to call out.
00:37:32.710 --> 00:37:41.239
Evan Ryan: firstly, the receipts, variance analysis. So those favorable variances and then unfavorable variances.
00:37:41.360 --> 00:37:47.629
Evan Ryan: and then the same side on the payments side as well. So those payment variance analysis.
00:37:49.230 --> 00:37:55.959
Evan Ryan: There's a table here for my top, 5 variants, so I can see my intercompany line item
00:37:56.170 --> 00:38:04.010
Evan Ryan: in the Ireland business unit had a variance of 6.7 million dollars. In this specific period
00:38:05.010 --> 00:38:23.699
Evan Ryan: a really exciting new feature or new part of this feature is the areas to investigate and act. And so, as Mark mentioned, you know, this really does save a lot of time. So you can see within a couple of moments. I've already generated an executive level summary report.
00:38:24.343 --> 00:38:34.089
Evan Ryan: I can easily copy this out, paste it into a an email. Send that to my manager to send that to the Cfo.
00:38:34.660 --> 00:38:40.080
Evan Ryan: But also highlighted here is that areas to investigate and act, and
00:38:40.350 --> 00:38:52.387
Evan Ryan: to really turn around that forecast accuracy and that you're seeing here. So in this case, 15.3% and really surfing, surfacing those insights.
00:38:53.110 --> 00:39:04.589
Evan Ryan: and no longer having to, you know. Dig through this report and go through that toil. It's already surfaced here so that you can quickly improve your forecast accuracy.
00:39:05.250 --> 00:39:13.779
Evan Ryan: I can also interact with the report here and give it a thumbs up and a thumbs down, and so that this report would be
00:39:14.220 --> 00:39:19.140
Evan Ryan: provided to you. You know, improved the next time you use it.
00:39:19.530 --> 00:39:29.789
Evan Ryan: So, as I said here, you know already I'm seeing great value from the spotlight panel. Those key variances are surfaced straightaway.
00:39:30.000 --> 00:39:37.640
Evan Ryan: and then once I click that generate insights button, I can see an executive summary level report is created here.
00:39:39.170 --> 00:39:43.730
Evan Ryan: but I can actually do a deeper dive on that
00:39:43.850 --> 00:39:48.389
Evan Ryan: on that data, on my report. So I can see a number of questions here.
00:39:48.640 --> 00:39:55.360
Evan Ryan: We've built up a bank of questions. I'm working with a an Sme group.
00:39:55.510 --> 00:40:07.040
Evan Ryan: and essentially the Llm. The AI. Is suggesting, based off of the content of this report. What questions best suit
00:40:07.380 --> 00:40:08.519
Evan Ryan: this report?
00:40:08.720 --> 00:40:11.780
Evan Ryan: So in this case. I'm going to ask.
00:40:11.970 --> 00:40:18.870
Evan Ryan: And AI, so what are my top? 5 closing balance variances by business unit?
00:40:19.250 --> 00:40:42.909
Evan Ryan: And essentially what this will do is generate a graph with a narrative attached to that graph here. So again, I've done this previously as well in previous roles, and I'm sure a lot of people on this call have done this where you're generating these graphs within excel, and you're picking different columns. But you can see how quickly
00:40:43.020 --> 00:40:45.020
Evan Ryan: this graph was generated.
00:40:45.580 --> 00:40:55.869
Evan Ryan: Again, I can copy this out individually, but what I would actually like to do is, I would like to add this to my report, and I can generate a final report
00:40:56.010 --> 00:40:57.000
Evan Ryan: at the end.
00:40:57.770 --> 00:41:04.420
Evan Ryan: So I'm going to ask a couple of more questions here. So how is my forecast accuracy trending?
00:41:04.930 --> 00:41:05.880
Evan Ryan: And
00:41:06.040 --> 00:41:18.169
Evan Ryan: so at a specific business unit level. And again, I'm going to get a graph that I can, you know, is quickly generated with a narrative. I could add that to my report.
00:41:18.330 --> 00:41:25.210
Evan Ryan: and in this case I'm wondering, you know, which business units at least accurate.
00:41:26.910 --> 00:41:47.139
Evan Ryan: So again, you know something that would take you know, time to download this report in excel imported, pull out my specific tables, build this in, excel, you know, quickly generate it, and I can add this to my report. So now that I have my executive summary report up top.
00:41:47.480 --> 00:41:52.179
Evan Ryan: and I've run my 3 different questions. But as if
00:41:52.680 --> 00:41:59.320
Evan Ryan: you'll note there, I've tagged each of them to be generated or to be included in a final report.
00:42:00.010 --> 00:42:09.809
Evan Ryan: So, rather than just generating a report where those 3 visualizations are kind of tagged on to the
00:42:10.280 --> 00:42:26.060
Evan Ryan: top summary, a cohesive narrative is actually created. So again, the AI is sent that 1st executive summary and those 3 reports, and is essentially prompted.
00:42:26.170 --> 00:42:27.840
Evan Ryan: and to be told.
00:42:28.000 --> 00:42:50.220
Evan Ryan: create a cohesive summary, a cohesive narrative based off of the executive summary and your 3 additional insights. And really, you know again. This is a fantastic time saver for users rather than having to go in, and, you know, adjust and update the narrative in the executive summary, and also
00:42:50.790 --> 00:43:04.839
Evan Ryan: the AI is prompted to disperse those visualizations as it best sees fit, and to, you know, ensure that there is a complete narrative. On the whole report.
00:43:05.429 --> 00:43:09.379
Evan Ryan: You know, and again, you know, users can export this to
00:43:10.240 --> 00:43:20.130
Evan Ryan: so that they can easily send this on in a board deck for for reporting, so I can see my executive summary is still here.
00:43:20.694 --> 00:43:21.935
Evan Ryan: You know. But
00:43:22.520 --> 00:43:32.100
Evan Ryan: I can see it's now, you know, focusing on it now knows that there is a business unit with the lowest frequency chart. So if I was to view the initial summary
00:43:32.240 --> 00:43:34.089
Evan Ryan: that wouldn't actually be there.
00:43:34.621 --> 00:43:46.259
Evan Ryan: Because, okay, so it's input this top 5 business unit by closing balance variance here again, not just tagging it on at the bottom, but creating that cohesive narrative.
00:43:47.282 --> 00:43:49.889
Evan Ryan: I can see my receipts, variance analysis.
00:43:50.716 --> 00:43:55.190
Evan Ryan: my payments, variance analysis. And then that forecast accuracy as well.
00:43:55.790 --> 00:44:05.690
Evan Ryan: So that's the forecast insights from the comparison report. I'm going to jump into the Consolidation report here.
00:44:05.850 --> 00:44:20.939
Evan Ryan: and I'll run my report. And again that consolidation report really is that Consolidated Bird's eye view of all of the different business units that I have in my system, in one cohesive view from a forecasting perspective.
00:44:21.340 --> 00:44:24.160
Evan Ryan: So again, I'm greeted with my spotlight panel.
00:44:24.860 --> 00:44:29.910
Evan Ryan: In this instance I can see there are 3 hidden cash flow differences uncovered.
00:44:30.060 --> 00:44:43.319
Evan Ryan: 1, st one is calling out the business units that are holding the most cash. So what business units are cash rich in this instance? So I can see the Uk. Canada and Netherlands.
00:44:44.390 --> 00:44:49.589
Evan Ryan: and very importantly as well what business units are experiencing.
00:44:50.228 --> 00:44:52.019
Evan Ryan: You know, short liquidity.
00:44:52.250 --> 00:45:00.899
Evan Ryan: Okay? So in this case there are 10 business units that are experiencing short liquidity. And the 3rd piece, then, is an overview of how my forecast
00:45:01.840 --> 00:45:08.990
Evan Ryan: is a going to basically trend over the next number of weeks. In this case, 13 weeks.
00:45:09.100 --> 00:45:17.300
Evan Ryan: I'm calling at the highest expected range over that week, those number of weeks so similar to the
00:45:17.966 --> 00:45:21.540
Evan Ryan: Comparison report. I'm going to generate my insights.
00:45:23.070 --> 00:45:45.850
Evan Ryan: you know, and as a user. You can really see the benefit of G. Smart here, straight off the bat again in the Consolidated report with that spotlight panel. Traditionally, users would have to download this in. Excel, start to go through it. Surface. Those, let's say, 3 business units that are cash, rich cash poor.
00:45:46.220 --> 00:45:58.550
Evan Ryan: whereas you know you can see straight away. I'm surfacing that information and but also again, like the Comparison report going into a deep dive analysis of the Consolidation report here.
00:45:59.160 --> 00:46:06.309
Evan Ryan: you know, obviously focusing on it from a liquidity perspective. Okay? So I have my executive summary
00:46:06.460 --> 00:46:22.960
Evan Ryan: and my current liquidity position. So in this case I can see I have 23.4 days of cash. So what's my starting balance? And what's my daily cash outflow? So in this instance, okay, I know I have 23.4 days of cash.
00:46:23.673 --> 00:46:37.219
Evan Ryan: Calling up my cash forecast. How that's looking over this 13 week period, and then the liquidity risk. So what business units are at risk from liquidity, perspective?
00:46:37.420 --> 00:46:44.740
Evan Ryan: What period does that call to, and the actual liquidity position for each of those business units.
00:46:45.630 --> 00:47:01.760
Evan Ryan: and similar to the comparison report highlighting those areas to investigate and act. So again, no longer having to dig through excel once you've exported this report. That's highlighted straight away so you can take, you know. Action.
00:47:02.292 --> 00:47:04.110
Evan Ryan: You know, straight off the bat
281
00:47:04.690 --> 00:47:25.460
Evan Ryan: again. I can copy this out. I can give it feedback, give it. A thumbs up, thumbs down, and you know, as I said, with the comparison report, consolidation report straight away. I'm getting great insights that I can easily send to senior management for reporting. But also I'm presented with a
00:47:25.580 --> 00:47:31.480
Evan Ryan: in this case 3 questions from a bank of questions that we've built up, that again, the
00:47:31.620 --> 00:47:38.869
Evan Ryan: AI is suggesting best fits the actual data in your graph or in your report here.
00:47:39.160 --> 00:47:44.389
Evan Ryan: So in this case, I want to know. Let's say, what business units
00:47:44.530 --> 00:47:48.120
Evan Ryan: are projected to run risk running out of cash.
00:47:49.340 --> 00:48:03.879
Evan Ryan: So again, similar to the comparison report, I'm going to be presented here with a table and and a narrative to go along with that table as well. So again say I want to add this to my report.
00:48:05.095 --> 00:48:09.319
Evan Ryan: Which, and let's say which business units have the highest cash position.
00:48:09.870 --> 00:48:12.897
Evan Ryan: And so here I I'm kind of
00:48:13.450 --> 00:48:17.840
Evan Ryan: told at a high level. In this case 10 business units and
00:48:19.800 --> 00:48:29.520
Evan Ryan: at expected to fall below the liquidity. And here we're calling it those top 5. Okay? So in this case I can see the United Kingdom.
00:48:31.110 --> 00:48:41.470
Evan Ryan: has the sorry in here. Yes, the the largest cash position. Here. We can see that the United Kingdom has the highest cash position, so I can add this to my report.
00:48:42.093 --> 00:48:46.976
Evan Ryan: And say, you know what business units are contributing most to
00:48:47.630 --> 00:48:58.589
Evan Ryan: Monster Cache Burn, so similar to the previous visualizations. I'm again presented with a table here and a narrative to go along with it.
00:48:58.760 --> 00:49:04.880
Evan Ryan: so I can add this to my final report, and I'm going to now request a final report.
00:49:05.370 --> 00:49:10.130
Evan Ryan: So, as I said with the comparison report here
00:49:10.580 --> 00:49:18.839
Evan Ryan: the Consolidation report, is sent to the AI, and then that executive summary is generated. I've asked.
00:49:19.180 --> 00:49:27.809
Evan Ryan: 3 insightful questions. And those insights are raised here and again those graphs
00:49:27.990 --> 00:49:53.869
Evan Ryan: and the narrative associated with them. They're not just appended to that executive summary up top. They're incorporated into the overall flow of the actual executive summary. So you know, again, saving time rather than having to go in and adjust the actual. You know executive summary. It intersperses those insights where it best fits, so that there's a cohesive narrative.
00:49:54.790 --> 00:50:01.450
Evan Ryan: So I can see here my business units with highest cash cash position and calls out, then the cash
00:50:01.780 --> 00:50:04.960
Evan Ryan: forecast. My average cash flows.
00:50:05.860 --> 00:50:19.169
Evan Ryan: my average cash outflows per business unit. And then my liquidity risk as well. And again, if I was to, kind of, you know, take a look through the narrative here again. It's going to tweak that nerve so that there is that
00:50:19.470 --> 00:50:26.960
Evan Ryan: cohesive narrative from a reporting perspective. Again, I can copy this out, put it into a board pack
00:50:27.340 --> 00:50:32.600
Evan Ryan: prepared for a deck that I can, you know, saves me a lot of time and and toil.
00:50:33.590 --> 00:50:38.799
Evan Ryan: So with that I'll stop sharing. I'll
00:50:41.013 --> 00:50:49.750
Evan Ryan: we'll now move into the question and answer section of the of the webinar today.
00:50:51.180 --> 00:50:58.759
Evan Ryan: And we just have A. So if you have any questions, you can enter them in the Q&A box.
00:50:59.660 --> 00:51:06.380
Evan Ryan: And so a couple of questions here. So the 1st one are users able to create forecast insight questions.
00:51:06.885 --> 00:51:30.040
Evan Ryan: So at the moment we have a bank of questions that we've created working with a group of Sme treasure users. But you know, if you are using the system and if there is feedback there that you want to. You know, there's, I suppose, multiple ways that we can receive feedback from a product perspective.
00:51:30.606 --> 00:51:32.540
Evan Ryan: One is within that feedback.
00:51:33.089 --> 00:51:45.659
Evan Ryan: Functionality. And if there are users that are, you know, requesting questions quite regularly. Then certainly we can look at adding those questions to that bank, of questions.
00:51:51.680 --> 00:51:56.460
Mark Johnson: Yeah, maybe I'll I'll it's a good question. We saw another question. Similar
00:51:56.830 --> 00:52:25.349
Mark Johnson: framework on just hey? If I have my own questions or I want to see more suggestions to Evan's point, definitely wanting to build that bank even further. So as we get more users in it where where we can be pretty responsive and and building more out there. Another question we had was around estimated data deployment for G. Smart. So what Evan just demo today is available for any cash forecasting
00:52:25.380 --> 00:52:31.090
Mark Johnson: customer. And we can help you guys with getting that enabled. And we'll have
00:52:31.140 --> 00:52:40.429
Mark Johnson: kind of a next step slide right after this. But then we are currently producing what we showed with risk and the hub
00:52:40.490 --> 00:52:54.849
Mark Johnson: and working through what that delivery date looks like this year as well, but also an an early access program there. So if those were of interest, then definitely, please reach out and we will make sure you're a part of of both of those programs, too.
00:52:58.034 --> 00:53:22.509
Evan Ryan: I see another question here. What controls are in place to verify the accuracy of the AR reporting great question. And you know a question that we've spent a lot of time on from a testing perspective. And so you know, the the key focus for us from a accuracy perspective is ensuring that the the figures within the report are correct.
00:53:22.750 --> 00:53:50.200
Evan Ryan: Within those insights are correct. There is a number of ways to approach this, but ultimately what we've done within the AI Middleware is to set up a golden data set, and we can then use the AI as a judge using Llm. As a judge. Essentially, you're training. You're ensuring that the answers that come out essentially match
00:53:50.840 --> 00:54:07.389
Evan Ryan: the input and so within the prompting as well, there are a lot of guardrails that are implemented there. So you know, to really focus on the accuracy of the actual figures, and to reduce any hallucinations.
00:54:09.270 --> 00:54:29.009
Mark Johnson: Another question around additional costs. Are there additional costs to G. Smart, if you're already a cash analytics customer. So for those who already have cash forecasting. There's no additional cost for what we just demoed our priority with. That experience is driving adoption and learning, and frankly improving it as we go.
00:54:29.290 --> 00:54:35.180
Mark Johnson: and for now there's no plans to to charge extra for that particular experience.
00:54:43.210 --> 00:54:50.710
Evan Ryan: Yeah. So I see. Another question here will AI be integrated with the trend forecast functionality in the future.
00:54:50.880 --> 00:54:55.116
Evan Ryan: And so currently, the plan. As Mark mentioned,
00:54:55.850 --> 00:55:04.069
Evan Ryan: during his presentation. The plan is currently to implement AI within due treasury risk.
00:55:04.260 --> 00:55:31.290
Evan Ryan: So apply those same forecasting insights that you saw here, but from a risk perspective, and then the hub as well. But additionally, then, towards the you know, in the next couple of months we'll be looking for different areas within the actual tool within forecasting and obviously within the G Treasury platform, where we can uplift the current functionality so we can enable AI there as well.
00:55:34.220 --> 00:55:57.202
Mark Johnson: The controls is a great question. So what controls are in place to verify the accuracy of the AI reporting? So I I can start, and then Evan can definitely jump into. So there's a lot that's frankly where a lot of the work comes into play to make sure. Hey, what you guys see in the insights panel is exactly reflective of your data within G treasury.
00:55:57.540 --> 00:56:09.940
Mark Johnson: And we do that in a couple of different ways. Number one, we use multiple AI models in the process. So think of it as not only is is a model involved in the
00:56:10.370 --> 00:56:35.200
Mark Johnson: creation of that insights panel, but also another model involved in the review of that information. So we've got extra checks and balances there. We've also got kind of like that preliminary work when it comes to setting up the appropriate prompting, setting up the appropriate evaluation standpoint of all responses that are generated. And then another component is.
00:56:35.250 --> 00:56:42.529
Mark Johnson: we have real time visibility into the outputs and making sure. Hey, we have our own
00:56:43.140 --> 00:56:45.310
Mark Johnson: accuracy measurement in real time.
00:56:45.420 --> 00:56:59.920
Mark Johnson: Und wir können dem folgen und darüber hinaus auch sehen. Evan erwähnte das Feedback-Panel mit den Daumen hoch, den Daumen runter und den Kommentaren, sodass wir direkt alles sehen können, was eingereicht wird, und natürlich entsprechend darauf reagieren können.
00:57:00.180 --> 00:57:01.639
Mark Johnson: Evan. Irgendetwas anderes.
00:57:01.640 --> 00:57:21.220
Evan Ryan: Nein, nein, du hast den Nagel auf den Kopf getroffen, wie ich schon früher gesagt habe, weißt du, wie du weißt, verwenden wir. Dann dieser Lom als Richter. Also das andere KI-Modell verwenden, um im Grunde zu beurteilen und sicherzustellen, dass Sie wissen, wie gut aussieht, und wieder, das wird innerhalb der
00:57:21.850 --> 00:57:26.359
Evan Ryan: KI-Service, damit wir sicherstellen, dass diese Erkenntnisse korrekt sind.
00:57:26.880 --> 00:57:33.980
Evan Ryan: Und ich sehe, hier gibt es noch eine weitere Frage dazu, wie wir sicherstellen, dass der Einblick
00:57:34.260 --> 00:57:47.010
Evan Ryan: Erkenntnisse ignorieren bestimmte Eingaben aus dem Bericht oder aus Sicht der Berichterstattung? Der Schlüssel dazu ist, Sie wissen schon, wirklich auf das abzuzielen, was Sie eingeben und in den
00:57:47.130 --> 00:57:56.560
Evan Ryan: Bericht aus der Sicht der Parameter. Sie wissen also, dass Benutzer den Bericht im Wesentlichen auf eine Vielzahl verschiedener Arten konfigurieren können. Also.
00:57:56.983 --> 00:58:18.620
Evan Ryan: Wissen Sie, ich hatte Telefonate mit einem unserer Early-Access-Programmbenutzer, in denen ich mich erkundigte, wie ich bestimmte Einzelposten oder Geschäftsbereiche ausschließen kann, aber Sie wissen, dass das einfach im Parameterbereich gehandhabt werden kann, indem Sie diese Elemente einfach abwählen, sodass der Bericht nicht wirklich abgerufen wird. An erster Stelle.
00:58:25.120 --> 00:58:46.139
Mark Johnson: Sieht nach ein paar Fragen dazu aus, wie wir über die Anwendung von G. Smart im Liquiditätsmanagement und Cashmanagement denken, und das ist definitiv ein Teil des Prozesses. Ich denke, das geht darauf zurück, wie wir beim Thema Risiko gelandet sind, und das war der nächste Bereich, der hauptsächlich auf Kundenfeedback zurückzuführen ist.
00:58:46.290 --> 00:59:13.600
Mark Johnson: Nun, wir wenden den gleichen Ansatz für Liquidität, Planung und andere Teile der Plattform an. Ihr habt also Ideen und Anwendungsfälle, weil ihr Interessen habt und seht, was heute gezeigt wurde und wie das auf andere Workflows direkt auf der Plattform angewendet werden könnte. Nun, wir haben definitiv ein offenes Ohr dafür. Und auf der nächsten Folie werden Sie sowohl meine Kontaktinformationen als auch Evans Kontaktinformationen sehen.
00:59:16.710 --> 00:59:17.470
Evan Ryan: Und.
00:59:17.470 --> 00:59:18.140
Mark Johnson: Damit. Vielleicht.
00:59:18.140 --> 00:59:18.580
Evan Ryan: Mach weiter!
00:59:18.580 --> 00:59:21.189
Mark Johnson: Noch eine Frage, und dann springen wir zum letzten.
00:59:21.190 --> 00:59:28.999
Evan Ryan: Ja, ja, ich wollte nur sagen, ich sehe, hier gibt es eine Art von Frage. Wie prognostiziert man die erste Woche, wann
00:59:29.625 --> 00:59:44.620
Evan Ryan: AR und Ap schließen ihr Hauptbuch in ihrem ERP. Das könnte etwas sein, das vielleicht außerhalb dieses Bereichs liegt, aber speziell aus der Smart-Ledger-Perspektive. Dort befinden sich die AR- und AP-Daten
00:59:46.100 --> 01:00:01.820
Evan Ryan: Lösung. Und dann können Sie Zuordnungsregeln verwenden, um diese AR- und AP-Daten dem zuzuordnen. Sie kennen die erste Woche Ihrer Prognose. Und nur ja, wie Mark schon sagte, ich bin mir der Zeit hier bewusst. Also ich denke, es macht Sinn, zur letzten Folie überzugehen.
01:00:02,960 --> 01:00:08,800
Mark Johnson: Ja. Also schau, ich weiß es wirklich zu schätzen. Nehmt ihr heute eine Stunde mit uns
01:00:08.960 --> 01:00:26.730
Mark Johnson: Ich hoffe, das ist das große Ziel, mehr darüber zu erfahren, was im Büro des CFO passiert. Es war hilfreich, wie wir als Unternehmen darüber nachdenken, sowohl intern aus kultureller Sicht, als auch mit G. Smart als Teil unserer Plattform
01:00:26.880 --> 01:00:46.830
Mark Johnson: und zögern Sie nicht, ein Foto vom QR zu machen. Code, in dem Sie direkt mehr über G. Smart erfahren können. Gleichzeitig sind sowohl meine Kontaktinformationen als auch Evans Kontaktinformationen unten aufgeführt. Wenn wir Ihre Frage nicht beantwortet haben, werden wir sicherstellen, dass sie auch individuell beantwortet wird.
01:00:47.080 --> 01:00:52.489
Mark Johnson: Also nochmal, danke euch für die Teilnahme. Danke für die wirklich tollen Fragen.
01:00:52,920 --> 01:00:55,970
Mark Johnson: und ich freue mich darauf, auf dieser Reise zusammenzuarbeiten.
01:00:57.160 --> 01:00:59.480
Evan Ryan: Danke. Leute, habt einen schönen Rest eures Tages.
Ausgewählte Ressourcen


.png)
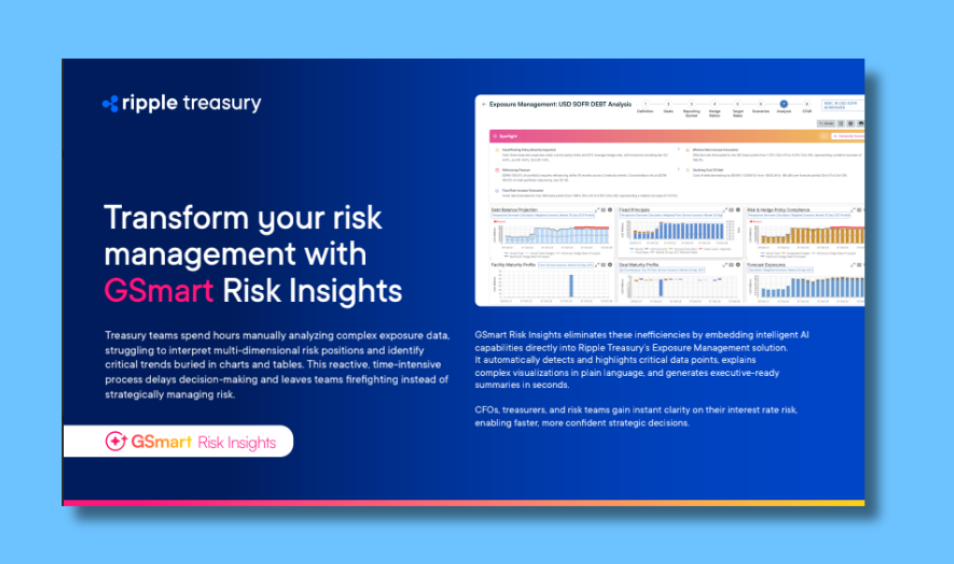
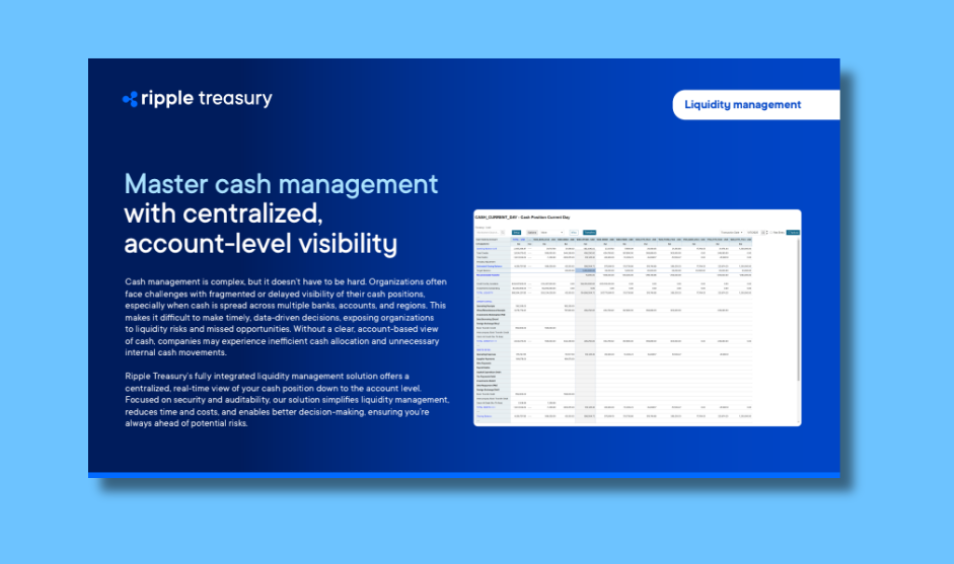


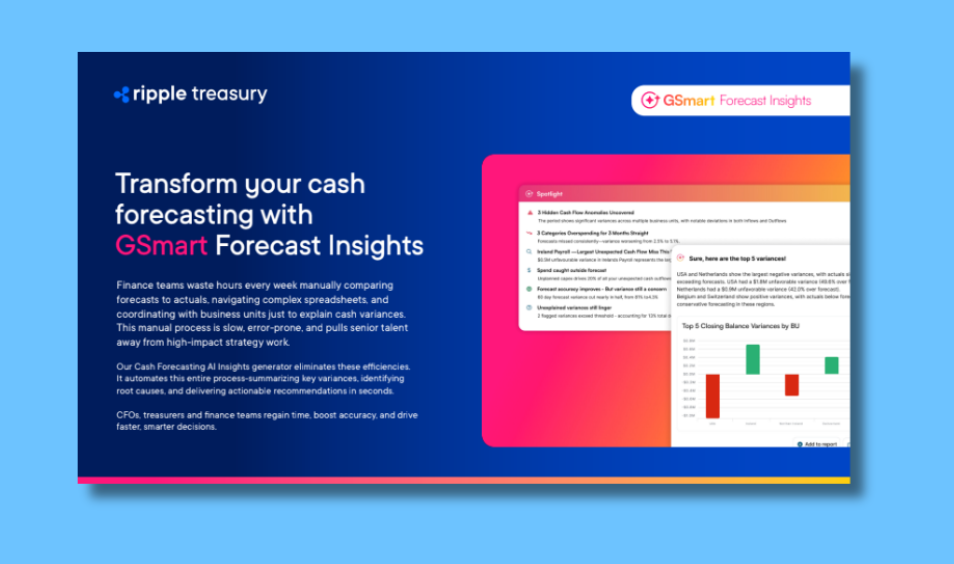
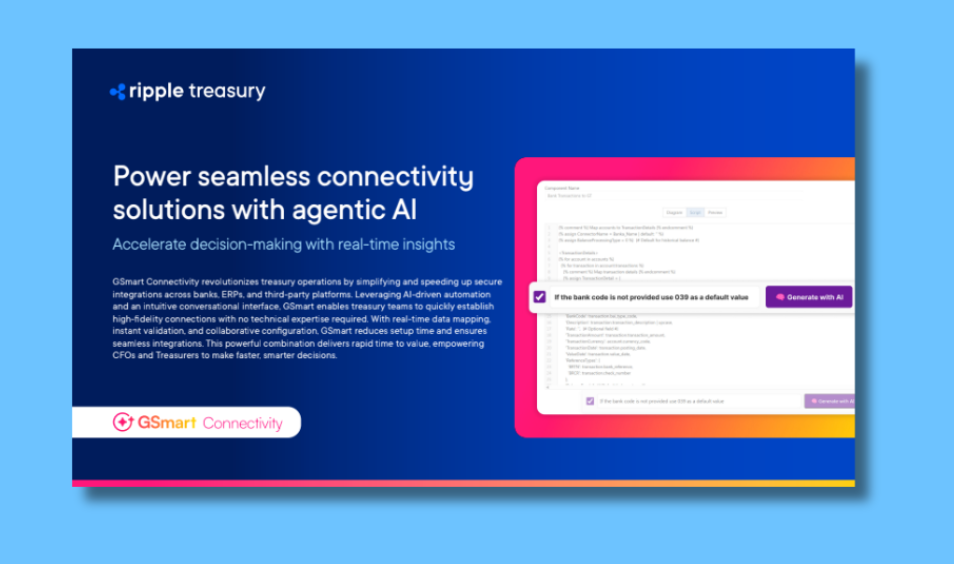
%404x.png)
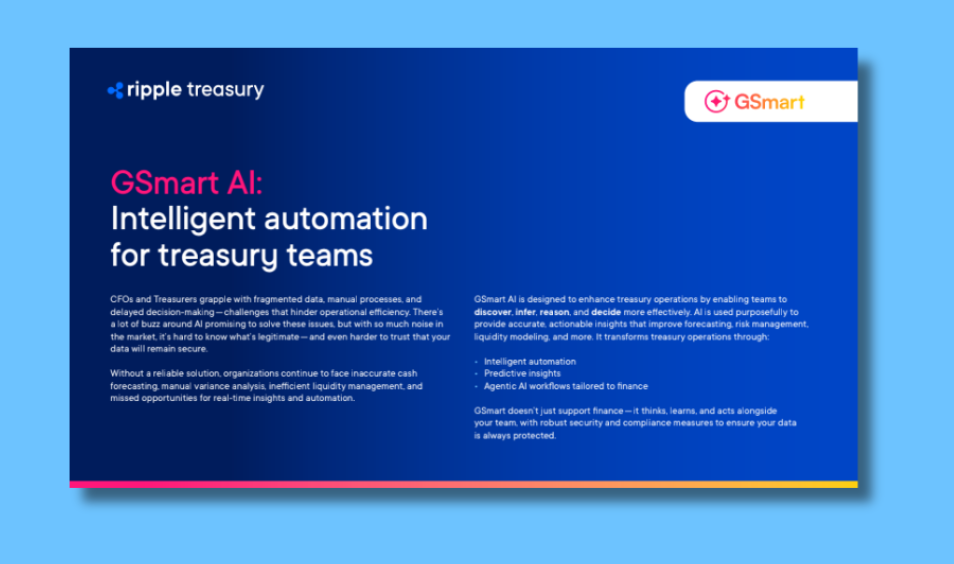

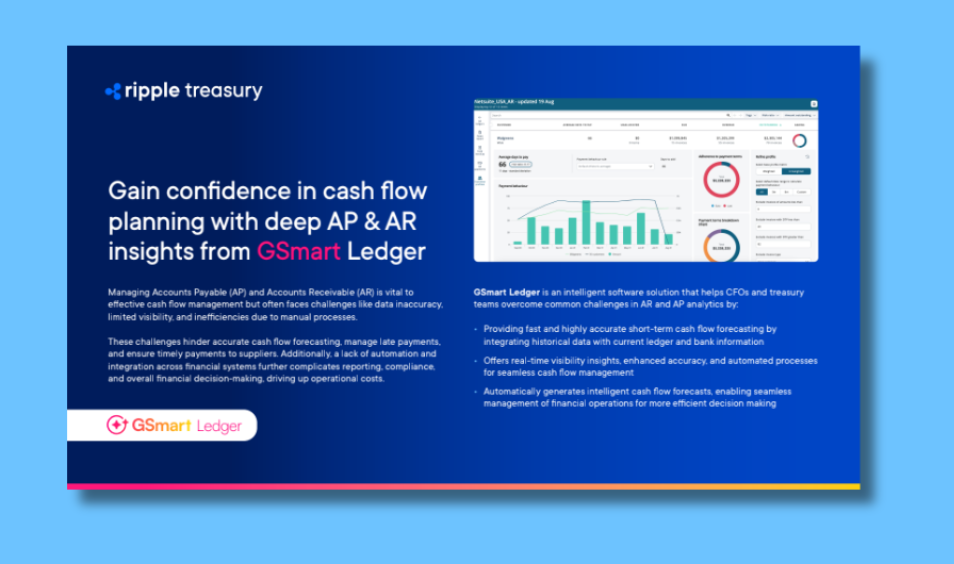

Siehe GTreasury in Aktion
Nehmen Sie noch heute Kontakt mit unterstützenden Experten, umfassenden Lösungen und ungenutzten Möglichkeiten auf.
